Every CMO knows the feeling. Budget review is two weeks away. The board wants proof that marketing spend is working. Your VP of Sales is asking why pipeline is thin. And your team is debating whether to double down on SEO or finally try ABM.
The problem is not strategy. The problem is data. Specifically, the right data, from the right year, about the channels you actually use.
This guide pulls from 200+ verified sources: platform reports, primary surveys, academic research, and real campaign benchmarks. Every claim has a source. No recycled stats from 2019 dressed up as "updated for 2025." These are the most current digital marketing statistics available for 2026, organized by channel so you can jump straight to what you need.
Key Marketing Statistics for 2026: The Numbers That Matter Most
Digital ad spend hit an all-time high in 2025. AI is no longer an experiment. It is operational infrastructure. Email still leads on ROI. And the companies pulling ahead are combining channels, not betting on just one.
Here are the most important digital marketing stats to know right now:
U.S. total digital ad revenue reached a record $294.6 billion in 2025 (150)
Global e-commerce spend hit $3.66 trillion in 2025, up 13% versus 2024 (35)
Generative AI tools now have 2.42 billion monthly active users, nearly doubling in one year (35)
Email marketing delivers $36 for every $1 spent (71)
Content marketing generates 3x more leads than outbound and costs 62% less (40)
Google processed 16.4 billion searches per day in 2025 (10)
49% of marketing professionals say organic search delivers the best ROI of any channel (145)
The average Google Ads CTR across all industries is 6.66%, with average CPC of $5.26 (229)
87.49% of marketers plan to increase influencer marketing budgets in 2026 (86)
Brands with strong omnichannel engagement achieve 89% customer retention vs. 33% for single-channel brands (26)
5.79 billion people are active on social media globally (35)
Every $1 invested in UX design yields $100 in return (223)
Only 6% of marketers have fully embedded AI into their workflows despite near-universal pressure to adopt (213)
These numbers tell one clear story. Digital has won. AI is table stakes. And channel diversification is not a strategy option anymore. It is the baseline.
What Is Digital Marketing?
Digital marketing is the promotion of products, services, or brands through digital channels: search engines, social media, email, websites, apps, and paid advertising platforms.
It is not one tactic. It is a system of interconnected disciplines. SEO drives traffic. Content builds trust. Email converts. Paid ads accelerate. Social builds awareness and community. Together they form a full customer acquisition engine.
The Digital Marketing Institute defines it as "the use of new media or digital technology to achieve marketing and business goals." (53) For B2B SaaS companies specifically, the definition is more precise. It means measurable pipeline. Attribution. Cost per lead. Revenue influence. Not vanity metrics.
Why does it matter for B2B?
Because 67% of the B2B buying journey now happens online before a prospect ever speaks to sales. (18) By the time a buyer contacts your team, they have already read your content, compared your competitors, and formed a strong opinion. Digital marketing is what shapes those invisible touchpoints.
It also scales in a way that headcount does not. A well-configured SEO program generates leads at an average of $206 per contact. (168)
The facts about digital marketing are consistent across industries: companies that invest in digital consistently outperform those that do not on both growth rate and customer acquisition efficiency.
Global Digital Marketing Industry Statistics for 2026
The global digital marketing market is enormous and growing fast. The estimates vary by scope and methodology. Every projection points in the same direction: up, and significantly.
There is no single agreed number for the global digital marketing industry size. Different research firms use different scope definitions. Here is what the major reports say:
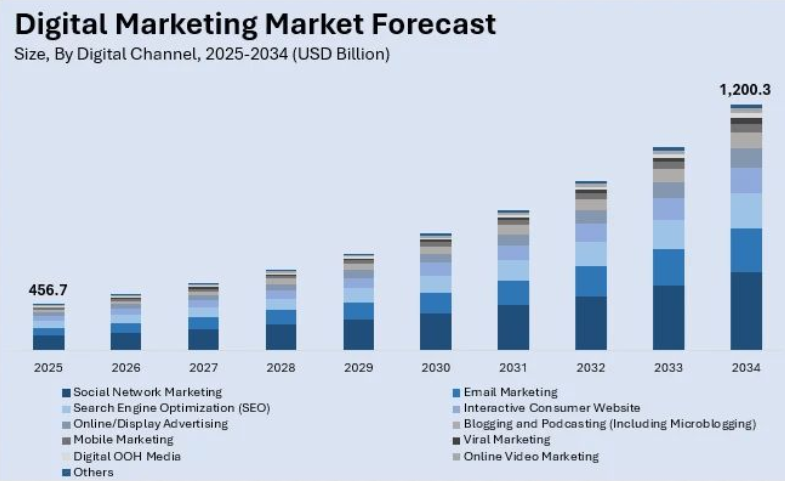
IMARC Group values the market at $456.7 billion in 2025, projected to reach $1.2 trillion by 2034 at a 10.99% CAGR. (82)
Figure 1. Global Digital Marketing Market Forecast by Digital Channel, 2025–2034 (USD Billion). Source: IMARC Group (82)
Expert Market Research puts it at $653.65 billion in 2025, reaching $1.576 trillion by 2035 at 9.20% CAGR. (64)
Why the range? Scope. Some count only digital advertising spend. Others include software, services, and the full marketing technology stack. None are wrong. They measure different things.
Digital advertising now commands 73% of total global media spend, with global digital ad spend reaching $740 billion in 2026 – up 11.4% year-over-year. (48)
U.S. total digital ad revenue reached $294.6 billion in 2025 – the largest digital ad market on the planet. (150)
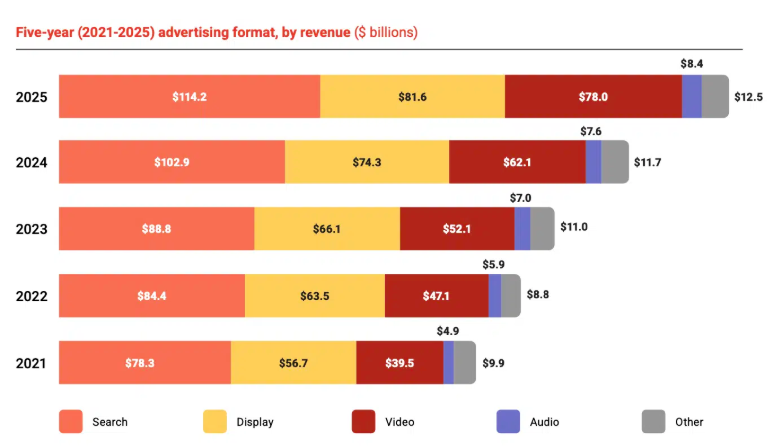
By format, search led at $114.2 billion (38.8% of total) and grew 11% YoY. Display reached $81.6 billion, video jumped 25% to $78 billion, audio held steady at $8.4 billion, and other formats totaled $12.5 billion. (150)
Figure 2. U.S. Digital Ad Revenue by Format, 2021–2025. Source: Search Engine Land (150).
The top 10 companies control 84.1% of U.S. digital ad revenue in 2025 – up from 80.8% in 2024. (150)
North America dominates with a 38.7% share of the global digital marketing market. The United States accounts for 84.30% of North America's digital marketing revenue. (82)
Asia Pacific (2.5B+ internet users) is the fastest-growing region; Europe 90%+ penetration; Latin America 75%; MEA ~60%. (82)
There are 6.12 billion internet users worldwide as of April 2026 – 73.8% of the global population. (35)
59 million new users came online in the past 12 months. (35)
2.17 billion people are still offline, representing the next wave of growth. (35)
The average internet user spends 33 hours and 13 minutes online per week. (35) That is nearly a full-time job's worth of digital attention available for brands to compete for every week.
Globally, users average 6 hours and 38 minutes online per day – 19 minutes more than in 2015. (56)
Global e-commerce spend reached $3.66 trillion in 2025 – up 13% year-over-year. 56.2% of internet users 16+ buy online at least once a week. (35)
Social media is the dominant online activity. 94.7% of all internet users are active on at least one platform. (35) The average user visits 6.5 different social platforms per month. (35)
These are the core marketing numbers that define the opportunity. The audience is online. The spending is online. The question is where your brand shows up within it.
Search Engine Optimization (SEO) Statistics
SEO still drives more traffic than any other single channel. AI Overviews are reshaping how that traffic distributes. The fundamentals have not changed. The tactics are evolving fast, and the brands tracking these shifts are gaining ground.
Neil Patel, co-founder of NP Digital, puts it directly:
"SEO is not dead. It is evolving. The brands that understand how AI is changing search will have a massive advantage over those still playing 2019 SEO."
Key SEO industry numbers
Organic search accounts for 57.8% of all web traffic worldwide. (10)
93% of all online experiences start with a search engine. (93)
49% of marketing professionals say SEO delivers the best ROI of any digital channel. (145)
SEO delivers leads at a fraction of the cost of paid channels. Organic search averages $206 CPL, compared to $463 for PPC and $840 for trade shows. (168)
53% of U.S. consumers research using a search engine before deciding to buy. (27)
63% of all shopping begins online even when the purchase happens offline. (88)
The SEO industry was worth $90 billion in 2024. (230)
92%+ of marketers plan to use SEO optimization for both traditional and AI-powered search. (81)
41% of marketers say updating their SEO strategy for AI is their top trend to explore right now. (81)
30% of marketers have already reported decreased search traffic as consumers shift to AI tools. (81)
U.S. organic search traffic declined 2.5% year-over-year in 2025; median publisher traffic is down 10% YoY. (217)
Google market share
Google holds 90.48% of the global search engine market as of 2025. (10)
On desktop specifically, Google's share is 83.19%, with Bing at 10.51%, Yahoo at 2.71%. (80)
Google alone processes 16.4 billion searches per day in 2025, equivalent to 190,000 per second. (10)
The typical internet user runs 4.2 Google searches per day. Roughly 3.9 billion people use Google daily. (10)
Rankings Statistics
75% of users never scroll past the first page. (147)
Only 6.6% ever go to page two or beyond. (98) If you are not on page one, you are effectively invisible to the majority of searchers.
The top-ranked organic result captures approximately 27.6% of all clicks according to Backlinko data. (7)
Nearly 60% of web pages currently ranking in the top 10 results are three or more years old. (10) Long-standing, authoritative content accumulates ranking advantages that newer pages take years to overcome.
The average first-page result contains approximately 1,447 words. (10)
Having a keyword appear in the first 100 words of a page is correlated with first-page rankings. (8)
The March 2026 Google Core Update reshaped results dramatically: nearly 80% of top-3 positions shifted, and approximately 1 in 4 top-10 pages fell out of the top 100 entirely. (148)
Organic Search CTR Statistics
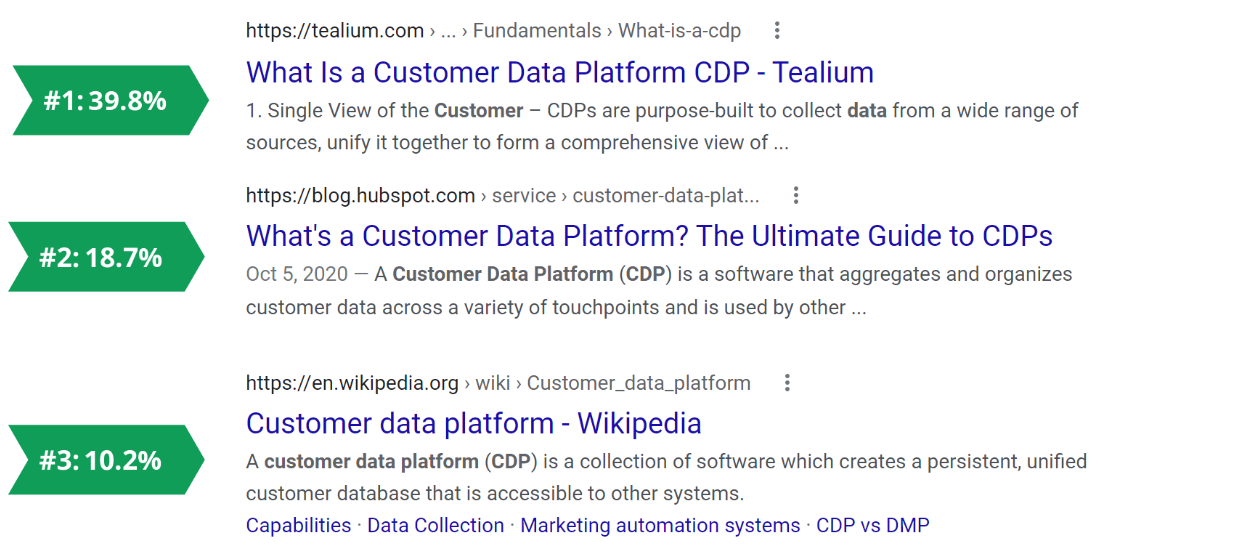
2026 Click-Through Rates (CTR) on Google Search Results Pages (70):
#1 organic result: 39.8% CTR (informational queries) / 27.6% avg across all types
#2: 18.7%
#3: 10.2%
#5: 5.1%
#10: 1.6% (70)
Figure 3. Google Click-Through Rates (CTRs) by Ranking Position in 2026 (70).
The #1 organic result gets 19x more clicks than the top paid ad on the same page (70)
Top 3 results combined capture 68.7% of all clicks on a search page (70)
Second-page results receive just 0.63% of all clicks (7)
Moving up one position increases CTR by an average of 32.3% (7)
Moving from #2 to #1 produces a 74.5% relative CTR boost (7)
A Featured Snippet in position 1 achieves 42.9% CTR; position 2 gets 27.4% (70)
94% of all webpages receive zero traffic from Google; only 1% get more than 10 clicks per month (154)
URLs containing the exact keyword get 45% higher CTR than non-matching URLs (7)
A CTR of 3%+ is a good benchmark; industry average is 1.91% for search, 0.35% for display (7)
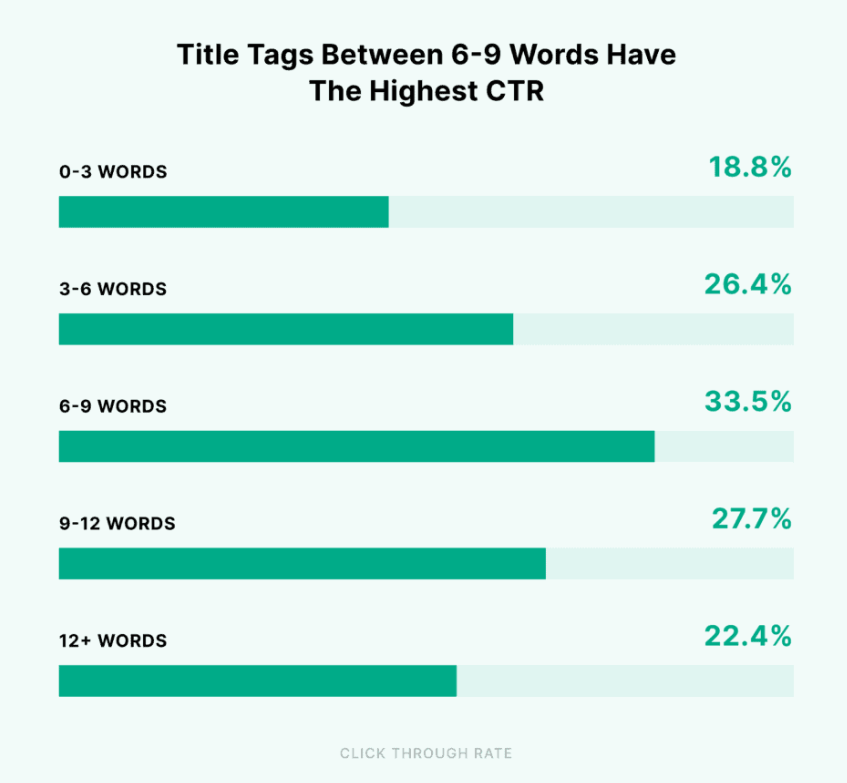
Title tags between 40–60 characters achieve 8.9% higher CTR; optimal length is 6–9 words (7)
Figure 4. Organic Click-Through Rate by Title Tag Length. Source: Backlinko (7)
AI Overviews Statistics
AI Overviews now appear on approximately 31% of Google search result pages. (70)
AI Overviews appeared in 13.14% of Google searches in 2025–2026, up from 6.49% in the prior period — a 102% increase in AI Overview presence. (217)
When they appear, organic CTR drops significantly. One study found CTR fell 61%, from 1.76% to 0.61%, when an AI Overview was present. (39)
On average, queries with AI Overviews show a CTR of 8% versus 15% for queries without them. (217) AI Overviews are estimated to reduce traditional organic CTR by approximately 15–20% across affected query types. (153)
60% of browser-based Google searches now end without any click. On mobile, that rate rises to 77%. (217)
Even for queries without AI Overviews, organic CTR dropped 41% — from 2.73% to 1.62%. (39)
Paid search CTR dropped 68% for queries with AI Overviews — from 19.7% to 6.34%. (39)
HubSpot lost 70–80% of its organic traffic following the AI Overview expansion. (217)
One documented case: impressions up +27.56% YoY while clicks fell 36.18% and CTR dropped from 5.98% to 3.35% — despite improving rankings. (39)
92.36% of successful AI Overview citations come from domains already ranking in the top 10 organic positions — ranking well still matters. (39)
AI-referred traffic converts 4.4x better than traditional organic search; ChatGPT's conversion rate is 15.9% vs Google organic at 1.76%. (134)
AI-referred sessions grew 527% year-over-year; generative AI traffic is growing 165x faster than organic search. (134)
24% of marketers are currently updating their SEO strategy specifically for generative AI search. (81)
🎧 The click equation isn't the only thing AI is rewriting.
If your site fails mobile performance standards, you are not competing in mobile search.
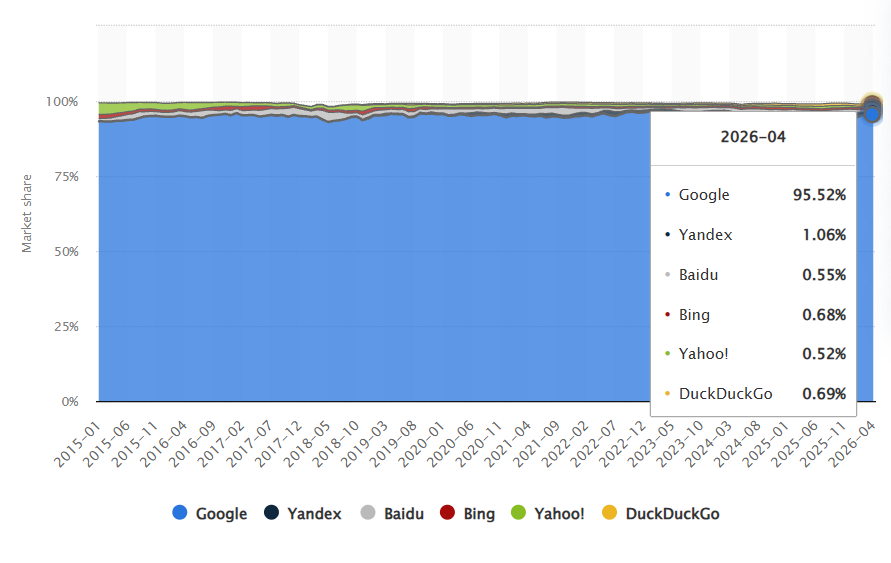
Google's mobile dominance is even more extreme. According to Statista, Google held 95.52% of the global mobile search engine market as of April 2026, while Yandex sat at 1.06% and competitors like Baidu and Yahoo each accounted for less than 1%. (237)
Figure 5: Global Mobile Search Engine Market Share, 2015–April 2026. Source: Statista (237).
Mobile organic CTRs average 5 percentage points lower than desktop results (153)
61% of mobile users are more likely to contact a local business if the website is mobile-friendly (77)
Only 48% of mobile websites achieved a "Good" Core Web Vitals score in 2025. (68)
Only 51% of the top 1,000 most popular mobile sites pass Core Web Vitals. (68)
Google ceased indexing non-mobile-accessible sites as of July 2024. (223)
Google Lens is used 12 billion times monthly; 90.6% of Google Lens results originate from mobile-responsive websites (May 2023 data) (223)
Voice Search Statistics
Voice search currently represents approximately 25% of all U.S. search queries — and could reach 50% by 2026. (153)
Over 20% of global internet users use voice assistants to find information. (36)
162.7 million Americans are projected to use voice assistants by 2027. (220)
Voice assistant usage on smartphones will reach 48.7% of internet users by 2029. (60)
40.7% of voice search answers come directly from Google Featured Snippets. (10) Voice search results average just 29 words and load 52% faster than average pages. (10)
Featured snippets are the target of ~30% of all voice search queries. (153)
75% of voice search results come from one of the top three desktop organic positions. (10)
Mobile voice searches are three times more likely to have local intent than typed searches. (10) Robust local SEO is an essential prerequisite for capturing voice search traffic from nearby customers.
Only less than 10% of marketers currently leverage voice search optimization — while 73.7% plan to maintain or increase investment in it. (81)
Technical SEO Statistics for 2026
Most sites are not technically clean. These gaps are opportunities:
Only 26% of websites use alt text for images; 36% have oversized images; 50% use duplicate meta descriptions; 54% have duplicate title tags. (154)
36% of websites have pages with 4XX errors; 18% contain broken images. (154)
25% of websites have duplicate content without proper canonical tags; only 42% implement canonical tags correctly. (153)
40% of JavaScript-heavy sites fail proper rendering for search engines. (153)
44% of websites use Schema markup — but 20% of those implementations contain validation errors. (153)
Only 52% of websites implement robots.txt files. (153)
15% of websites misuse noindex tags on pages that should be indexed. (153)
HTTPS adoption has reached 91%+ across the web. (149)
Title tag adoption is near 99%. (149)
Canonical adoption rose from 65% to 67%+ in 2025. (149)
GPTBot crawling presence grew from 2.9% to 4.5% on desktop in 2025 — a 55% increase. (149) Claude's bot nearly doubled from 1.9% to 3.6% in the same period. (149) AI crawlers are indexing the web at an accelerating pace, making structured, machine-readable content more valuable than ever.
Backlinks Statistics
Link building is the 3rd most important SEO ranking factor, after content and keywords. (42)
Pages ranking #1 have 3.8x more backlinks than pages ranking #2–#10. (42)
92.3% of the top 100 ranking websites have at least one backlink. (42)
94% of online content has no external backlinks; only 2.2% of pages successfully acquire them. (42)
Top-ranking pages gain 5–14% more dofollow links every month, compounding their authority over time. (152)
Annual backlink growth for competitive sites averages 15–20%; tech and finance sectors see 18–22%. (153)
Content over 3,000 words earns 3.5x more backlinks than shorter articles. (42)
Blog posts with 3+ embedded videos attract 55% more backlinks. (152)
Link-building takes an average of 3.1 months to deliver noticeable results. (42)
80% of SEOs report that a backlink typically takes 2–6 weeks to impact search rankings. (154)
Average cost of a quality backlink: $508.95; guest post: $609; link insertion: $141. (42)
High-quality contextual backlinks: $700–$2,000+ per link. (152)
63% of backlinks point to a website's homepage; approximately 30% of all backlinks carry medium or high toxicity. (154)
43.7% of top-ranking pages contain reciprocal links. (152)
73.2% of marketers believe backlinks influence the likelihood of appearing in AI-generated search results. (42)
Over 70% of major search engines now use AI to detect, devalue, or penalize low-quality or AI-generated backlinks. (42)
Keywords Statistics
74% of all keywords have 10 or fewer monthly searches; only 0.024% of keywords exceed 100,000 searches per month (154)
Long-tail keywords (10–15 words) generate 2.62x more clicks than single-word terms (7)
44% of Google searches involve branded terms; 56% are unbranded, generic queries (154)
32.9% of internet users aged 16+ discover new brands, products, and services via search engines (36)
23% of Google users select a query from autocomplete suggestions; 50% click a result within 9 seconds of searching (154)
Related Searches appears in 85% of all SERPs; Review rich results appear in 79% (154)
14% of all keyword searches are made to find local businesses or information (154)
Video SEO Statistics
Videos appear in 78% of U.S. Google search result pages; images appear in 35% (154)
Video results in Google SERPs achieve CTR of 2.3%–6.4% depending on query type (70)
50% of all Google searches feature at least one social media platform in the top 10 organic results; YouTube appears in 19.8% of those (154)
An AI Overview position 1 achieves 38.9% CTR – nearly equal to a standard organic #1 position – and video content structured for AI citation captures this format (70)
💡 Putting all of this into action takes more than reading stats.
Want a step-by-step playbook? Download our free AEO + SEO Checklist built to help you rank in both AI Overviews and classic Google.
Online Advertising Statistics: The Full Picture
Digital advertising commands 73% of total global media spend; global digital ad spend reached $740 billion in 2026, up 11.4% year-over-year. (48)
Global digital ad spend: $526.17 billion in 2024; exceeded $650 billion in 2025. (2, 64)
U.S. total digital ad revenue: $294.6 billion in 2025 – a new record. (150)
U.S. digital ad spending projected to exceed $383 billion by 2027. (197)
The top 10 companies control 84.1% of U.S. digital ad revenue – up from 80.8% in 2024. (150)
In 2025, U.S. digital ad revenue by format broke down as programmatic at $162.4B (+20.5% YoY), social media at $117.7B (+32.6%), search at $114.2B (+11%), and digital video at $78B (+25.4%) – per IAB/PwC's Internet Advertising Revenue Report 2025, via Search Engine Land. (150)
Format
Revenue
YoY Growth
Search
$114.2B
+11%
Social Media
$117.7B
+32.6%
Digital Video
$78B
+25.4%
Programmatic
$162.4B
+20.5%
Table 2. U.S. Digital Ad Revenue by Format, 2025. Source: IAB / PwC Internet Advertising Revenue Report 2025, via Search Engine Land (150).
Table 2. U.S. Digital Ad Revenue by Format, 2025. Source: IAB / PwC Internet Advertising Revenue Report 2025, via Search Engine Land (150).
Mobile accounts for 77% of all digital ad spend in 2024 – and by 2028, 70% of worldwide digital ad revenue is expected to come from mobile. (154, 230)
Search ads increase brand awareness by 80% even before a click happens. (230)
Social media advertising has become the backbone of digital marketing in 2025, with global ad spend reaching $207 billion across all platforms. (167)
The global social media advertising market is projected to reach $338.75 billion in 2026, growing at an 11.86% CAGR to $530.34 billion by 2030. The U.S. alone will generate $126 billion in 2026, with 82.9% of all social ad spend coming from mobile by 2030. (186)
Meta is forecast to reach $243.46 billion in worldwide ad revenues in 2026, overtaking Google ($239.54 billion) for the first time. Meta now commands 26.8% of global ad spend, while Google's share has slipped to 26.4%. (62)
B2B ROI by paid social platform:
LinkedIn: 113% return on ad spend (highest for B2B)
Facebook / Instagram: ~29% (168)
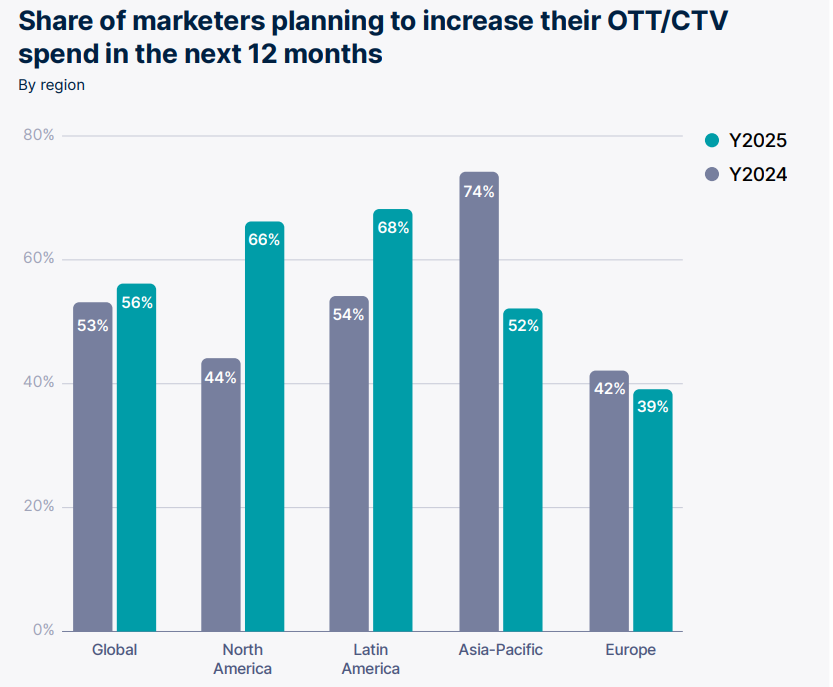
56% of global marketers planned to increase OTT/CTV spend in 2025, up from 53% in 2024 – one of the few channels showing year-over-year growth. (122)
North America led the YoY surge: 66% of marketers planned to increase OTT/CTV spend in 2025, up from 44% in 2024 – a +22-point jump. (122)
In Latin America, 68% of marketers planned to increase OTT/CTV spend in 2025, up from 54% in 2024. (122)
Asia-Pacific saw the largest pullback – 52% planned increases in 2025, down from 74% in 2024. (122)
Europe also declined slightly – 39% in 2025 vs. 42% in 2024. (122)
In the U.S., streaming now accounts for 42.4% of ad-supported viewing time (Nielsen's The Gauge, Q1 2025). (122)
Figure 6. Share of Marketers Planning to Increase OTT/CTV Spend Over the Next 12 Months, by Region (122).
64.6 million live video viewers in the U.S. in 2024. (228)
Digital audio ad spending reached $12.16 billion in 2025 and is projected to hit $14.84 billion by 2029. (185)
Users exposed to display ads are 155% more likely to subsequently search for brand-specific terms. (230)
Nine out of every ten dollars spent on display advertising in the U.S. now flows through programmatic buying. (208)
Banner ad spending in the U.S. is predicted to pass $74 billion in 2026. (184)
47% of B2B companies use display ads to increase the visibility of their content. (171)
65% of global marketers saw retail media networks playing a growing role in their media strategy in 2025 – highest in North America (74%), lowest in Europe (48%). (122)
Most marketers now use retail media across the entire consumer journey, not just for bottom-funnel conversions. (122)
Retail media combines first-party data precision with e-commerce scale – making it one of the most targeting-accurate formats available in a post-cookie environment.
54% of global marketers planned to reduce ad spending in 2025. Technology companies lead all industries in planned cuts – 70% likely to reduce budgets, compared to Automotive (54%), Financial Services (51%), Travel & Tourism (51%). (122)
Digital ad fraud cost U.S. advertisers $15.9 billion in a single year. (181)
Nearly half of U.S. consumers – and more than half of users globally – have installed or used ad blockers, and those numbers have stabilized at scale. The driver is no longer technical preference but defensive habit: intrusive formats, excessive tracking, and shrinking trust in digital platforms have made ad blocking a baseline behavior. (117)
Ad blocking was forecasted to cost publishers $54 billion in lost revenue in 2024. (141)
Pay-Per-Click (PPC) Statistics
PPC costs are rising, but so is performance for well-optimized campaigns. The channel remains the most reliable for generating immediate, measurable traffic with a clear attribution path. Costs have increased five years in a row. That means execution discipline matters more than ever.
PPC delivers an average return of $2 for every $1 spent. (230)
84% of brands say they see good results with their PPC campaigns. (138)
76% of small businesses report being satisfied with their search advertising results. (229)
Website visitors from PPC are 50% more likely to convert than organic visitors. (230)
80% of companies focus on Google Ads for their PPC campaigns. (226)
53% of all PPC clicks come from mobile devices. (49)
The average SMB PPC budget ranges from $100 to $10,000 per month. (139)
B2B PPC averages $463 CPL. (168)
The 2025 search ads benchmarks across all industries, based on WordStream's analysis of 16,000+ campaigns (229):
Average CTR: 6.66% (up 3.74% YoY)
Average CPC: $5.26 (up 12.88% YoY, affecting 87% of industries)
Average conversion rate: 7.52% (improved for 65% of industries, +6.84% YoY)
Average CPL: $70.11 (up from $66.69 in 2024, +5.13% YoY)
Google Ads search advertising costs have increased year-over-year for five consecutive years. CPL increased for 87% of industries, with a 25% average YoY increase. (229) Rising costs are not a trend. They are the new baseline.
Industry CTR varies more than 2.4x across business categories. Here is the full breakdown from WordStream's analysis of 16,000+ Google Ads campaigns (229):
Business Category
Average CTR
Arts & Entertainment
13.10%
Sports & Recreation
9.19%
Shopping, Collectibles & Gifts
8.92%
Travel
8.73%
Real Estate
8.43%
Finance & Insurance
8.33%
Automotive — For Sale
8.29%
Personal Services
7.69%
Restaurants & Food
7.58%
Health & Fitness
7.18%
Apparel / Fashion & Jewelry
6.77%
Physicians & Surgeons
6.73%
Animals & Pets
6.58%
Career & Employment
6.57%
Home & Home Improvement
6.37%
Industrial & Commercial
6.23%
Furniture
6.11%
Attorneys & Legal Services
5.97%
Education & Instruction
5.74%
Beauty & Personal Care
5.71%
Business Services
5.65%
Automotive — Repair, Service & Parts
5.56%
Dentists & Dental Services
5.44%
Table 1. Average Google Ads CTR by Business Category, 2025. Source: WordStream's analysis of 16,000+ campaigns (229).
Industry CPC, CVR, and CPL ranges follow similar variance patterns (229):
Business Category
Average CTR
Arts & Entertainment
13.10%
Sports & Recreation
9.19%
Shopping, Collectibles & Gifts
8.92%
Travel
8.73%
Real Estate
8.43%
Finance & Insurance
8.33%
Automotive — For Sale
8.29%
Personal Services
7.69%
Restaurants & Food
7.58%
Health & Fitness
7.18%
Apparel / Fashion & Jewelry
6.77%
Physicians & Surgeons
6.73%
Animals & Pets
6.58%
Career & Employment
6.57%
Home & Home Improvement
6.37%
Industrial & Commercial
6.23%
Furniture
6.11%
Attorneys & Legal Services
5.97%
Education & Instruction
5.74%
Beauty & Personal Care
5.71%
Business Services
5.65%
Automotive — Repair, Service & Parts
5.56%
Dentists & Dental Services
5.44%
Paid search CTR by ad position in 2025:
Ad #1 – 2.1%,
Ad #2 – 1.4%,
Ad #3 – 1.3%,
Ad #4 – 1.1%. (70)
Average CTR for top 3 ad positions: 1.5%, down from 1.7% in 2024. (70)
Paid search delivers a 2.9% channel conversion rate – the highest of any digital channel. (177)
Landing page conversion rates for paid search: Finance from paid search 5.2%, B2B tech from paid search 1.5%, overall paid search average 3.2%. (94)
Seer Interactive's analysis of 25.1 million impressions across 42 organizations found that paid search CTR dropped 68% for queries with AI Overviews present – from 19.7% down to 6.34%. (39) For high-intent, commercial queries where AI Overviews are expanding, PPC budgets are generating fewer clicks at higher cost per click. Bid strategies and match types need to account for this.
Content Marketing Statistics
84% of organizations have a documented content marketing strategy. (179)
But only 12% of B2B marketers describe their content marketing as highly effective; another 47% call it somewhat effective – meaning the majority of programs underperform their stated goals. (29)
Content marketing generates 3x more leads than traditional outbound marketing while costing 62% less. (40)
Brands using content as a primary lead driver see up to 6x higher conversion rates than those who do not. (111)
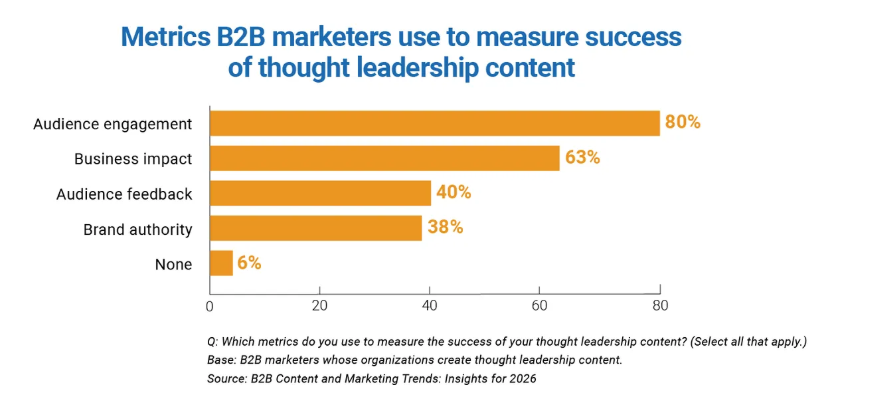
Metrics B2B marketers use to measure of thought leadership content:
80% of marketers measure thought leadership success through audience engagement – views, downloads, shares
63% measure it through business impact – leads and pipeline influence
Figure 7. Metrics B2B Marketers Use to Measure Thought Leadership Content Success (Multiple Responses Allowed). Source: Content Marketing Institute (29).
61% of B2B respondents cite trust and credibility as the most important benefit delivered by content – ranking above engagement (57%) and lead generation (55%) (171)
54% of businesses spending $2,000+ on a single piece of content report a successful strategy (151)
61% of companies are measuring content marketing ROI (209)
41% of marketers measure content marketing success through direct sales contribution (81)
Ann Handley, Chief Content Officer at MarketingProfs:
"Good content is not about storytelling. It is about telling a true story well."
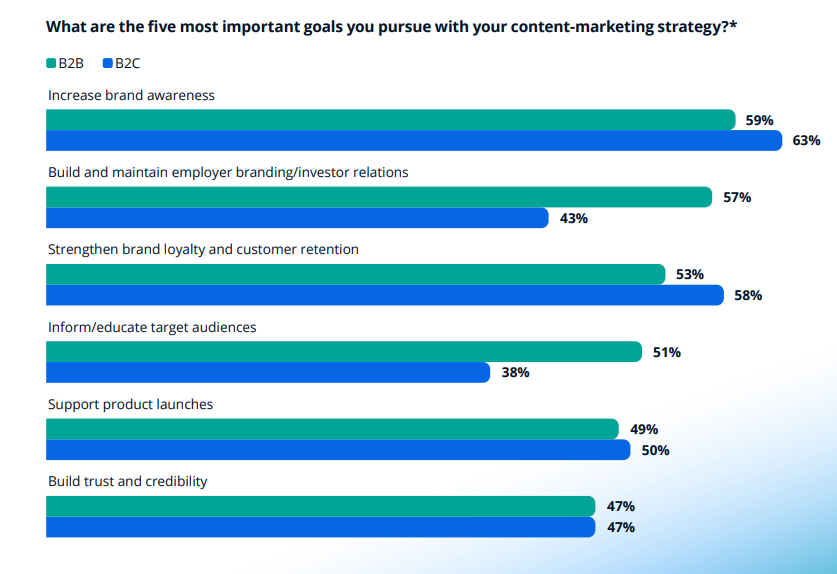
Top B2B content marketing goals (Statista+ Content Marketing Trend Study 2025):
Brand awareness – 59% of B2B marketers name it as their #1 goal (171)
Building employer brand / investor relations – 57% (171)
Generating leads – 55% cite this as a key benefit of doing content well (171)
For B2C, the top goal mirrors B2B: brand awareness leads at 63%. (171)
Figure 8. Top Five Content Marketing Goals: B2B vs. B2C Comparison. Source: Statista (171)
Blog Statistics That Matter
B2B companies with a blog get roughly 67% more leads per month than those without one.
Companies publishing 15 or more blog posts per month generate around 1,200 new leads monthly on average. (18)
Websites with active blogs have 434% more indexed pages, creating more keyword-ranking entry points. (126)
Blog posts ranked as the third most popular content format used by marketers in 2025 – after short-form video (60%) and long-form video (38%); blogs themselves at 38% (81)
Blog posts are among the top 5 highest-ROI content formats – cited by 22.26% of marketers (81)
Small businesses are 23% more likely than average to see ROI from blog content (81)
Blog posts rank among the top 5 formats marketers plan to invest most in for 2026 (81)
Average blog post length in 2025: ~1,333–1,350 words – decreasing for the second consecutive year (81, 154)
The average blog post length for top-ranking content sits at approximately 1,333–1,447 words. (10, 154)
AI Content Is Now the Norm
94% of marketers plan to use AI in their content creation processes in 2026. (81)
80% already use AI for content creation and 75% use it for media production. (81)
Content creation is the top AI use case across all marketing functions.
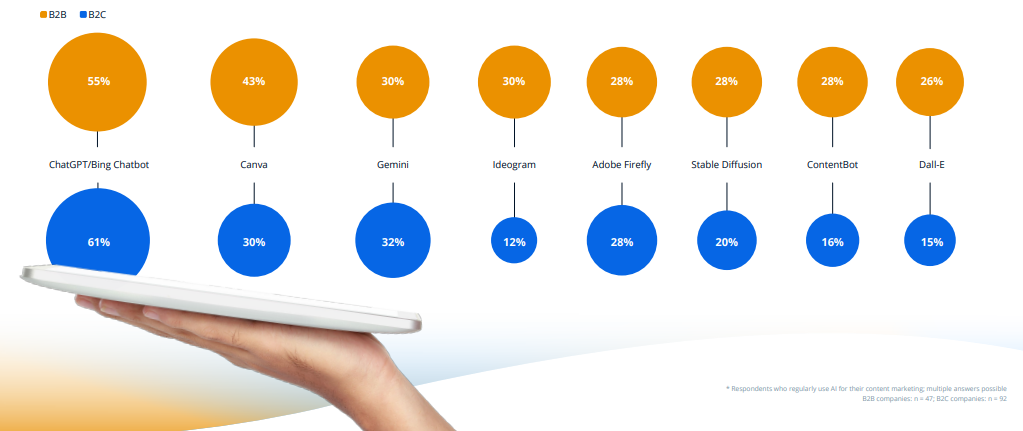
55% of B2B marketers use ChatGPT/Bing Chatbot for content marketing – the most widely used AI tool (171)
47% of B2B AI users apply it specifically for content creation – text, image, and video (171)
63% of B2B marketers plan to expand AI use for content creation and optimization in 2025 (171)
53% plan to expand AI use in SEO in 2025 (171)
50% plan to expand AI use in data analysis and reporting (171)
Figure 9. Most-Used AI Tools for Content Marketing: B2B vs. B2C Adoption Rates. Source: Statista (171).
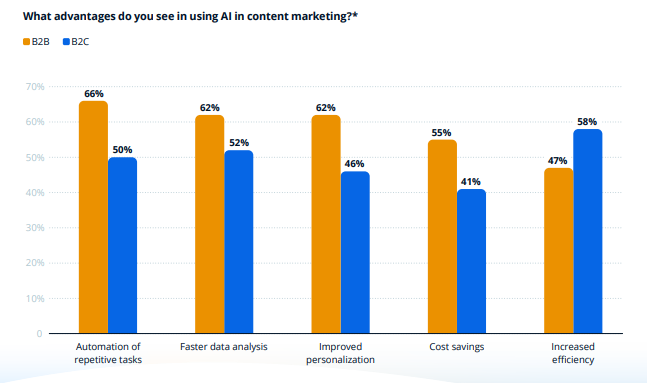
Top advantages B2B marketers cite for AI in content:
Automation of repetitive tasks — 66% (171)
Faster data analysis — 62% (171)
Improved personalization — 62% (171)
Increased efficiency — 58% (171)
Cost savings — 55% (171)
Figure 10. Top Perceived Advantages of AI in Content Marketing: B2B vs. B2C Comparison. Source: Statista (171).
Top AI adoption challenges:
Data protection and security — 55% (171)
Integration into existing processes — 51% (171)
Quality of generated content — 51% (171)
Content Formats Performance Data:
Short-form video (49%), long-form video (29%), and live streaming (25%) are the top three ROI-driving formats according to HubSpot's 2026 State of Marketing report. (81)
Short-form video is the most leveraged media format by marketers and delivers the highest reported ROI (81)
73% of consumers prefer a short-form video to learn about a product or service (218)
92% of businesses consider video one of the most important parts of their digital strategy (230)
61% of B2B content marketers are investing more in video in 2025 than the previous year (191)
88% of marketers say video marketing helps generate more leads (47)
60% of listeners searched for a product after hearing about it in a podcast (114)
25% of marketers currently leverage podcasts or audio content as part of their strategy (81)
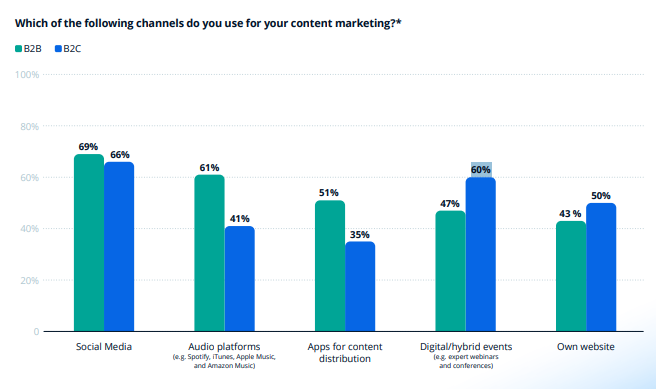
61% of B2B companies already use audio platforms (Spotify, Apple Music, etc.) as part of their content strategy – vs. only 41% of B2C marketers (171)
Gated content converts up to 41% more visitors into leads compared to ungated content (47)
Most-used B2B content distribution channels (171):
Social media – 69% of B2B marketers (most widely used channel)
Digital and hybrid events (webinars, conferences) – 60%
Apps – 51%
Company website – 43%
Audio platforms – 61%
Figure 11. Content Marketing Distribution Channels: B2B vs. B2C Usage. Source: Statista (171).
86% of B2B companies that do their own content marketing are already leveraging data-driven storytelling in their content strategy. Where data storytelling is being applied (171):
Social media posts – 54%
Video formats (explainer videos, GIFs) – 42%
Audio / podcasts – 38%
Whitepapers / e-books – 35%
Blog posts – 30%
Infographics – 28%
Top content marketing challenges:
Creating enough high-quality content – 55% of B2B marketers name this their central challenge (171)
Lack of technology/tools – 47% (171)
Audience segmentation challenges – 45% (171)
84% of B2B marketers say collecting data and measuring content performance across platforms is challenging (151)
13% of marketing leaders say content strategy itself is their top overall challenge (81)
The solution is not producing more. It is producing less, better, and distributing it more aggressively across the channels where your buyers already spend time.
Social Media Marketing Statistics
97% of online consumers access social media at least once a month (121)
5.79 billion social media user identities exist globally as of April 2026, representing 69.9% of the global population. (35)
294 million new users joined in the past 12 months, added at a rate of 9.3 per second. (35)
The average user visits 6.5–6.8 different social media platforms per month. (35, 44)
93% of marketers cite increased brand exposure as the primary benefit of their social media efforts. (121)
64% of the world's population uses social media (37)
46.1% of global consumers use social media for brand research (36)
84% of content sharing happens outside of social media: on messaging apps, email, and SMS (121)
U.S. businesses spent $82 billion advertising on social media in 2025 (206)
U.S. social media ad revenue rose 32.6% to $117.7 billion in 2025 (150)
29% of global marketers plan to increase social media budgets by more than 50% in the next 12 months (122)
Brands using user-generated content see 20% higher engagement (115)
Funny content is the most effective format for 66% of social media marketers; relatable content for 63%; trendy content for 59% (81)
56% of marketers use social media as a means of content promotion (151)
90% of social media marketers say building an active online community is crucial to a successful strategy (81)
48% of social media marketers share similar or repurposed content across platforms (81)
Businesses earn an average of $5.78 for every dollar spent on influencer marketing (51, 164)
Platform by Platform
Facebook
Facebook remains one of the largest advertising platforms in social media by reach.
Facebook ad reach: 2.28 billion potential audience; YouTube leads globally with 2.65 billion (32, 38)
54.33% of the world's population uses Facebook every month (6)
Meta is forecast to reach $243.46 billion in worldwide ad revenues in 2026, overtaking Google ($239.54 billion) for the first time and commanding 26.8% of global ad spend (62)
86% of marketers use Facebook to promote their business (200)
76% of American adults can be reached with Facebook ads (161)
Over 200 million small businesses use Facebook Pages (1)
10 million+ active advertisers on Facebook (22)
43% of marketers rank Facebook as their highest-ROI social platform (81)
U.S. adults spend an average of 33 minutes per day on Facebook (201)
70%+ of Facebook users visit local business pages at least once a week (67)
19% of U.S. consumers start their shopping search on Facebook (61)
Video posts on Facebook drive a 1,055% higher share rate and 110% more interactions than other post types (17)
Facebook video ads achieve an 8% click-through rate (222)
Average CPC for Facebook ads: $0.87 (Nov 2025) (156)
Instagram
Instagram has 2.99 billion monthly active users globally in 2025 (196); 80.4% are under 45 (202)
70% of marketers use Instagram — the most widely used platform among marketers (81)
Instagram is the most-cited social platform for ROI among marketers (81)
90% of Instagram users follow at least one business account (25)
75% of users take action after seeing an Instagram ad (161)
60% of users discover new products on Instagram (99)
Users spend ~33.9 minutes per day on Instagram (32.4 min on Android worldwide; 33.1 min for U.S. adults 18+) (9)
500 million daily active users engage with Instagram Stories (210)
Instagram Carousels generate 2.2x more views than Reels — making Carousels the highest-reach format on Instagram (165)
Instagram is projected to account for more than half of Meta's ad revenue in 2025 (142)
Video ads on Instagram see 38% higher engagement than image posts (15)
Instagram feed ad CTR: 0.22%–0.88%; Stories ad CTR: 0.33%–0.54% (162, 173)
TikTok
TikTok is the channel most marketers are betting on for 2026.
TikTok was the most downloaded social media app in 2025 — second most downloaded overall app after ChatGPT (190)
57% of marketers are already using TikTok; 32% say it consistently offers the highest ROI — the fourth-highest of any platform (81)
TikTok is the platform most marketers plan to invest in most in 2026 (81)
TikTok is projected to generate approximately $44 billion in advertising revenue in 2026 (192)
TikTok expected to account for ~40% of global video ad revenue by 2027 (192)
59.4% of brands plan to increase their influencer marketing budget — and TikTok is the most popular influencer marketing channel, used by 68.8% of brands (87)
Global Android users average 31 hours 32 minutes per month watching TikTok content (219)
U.S. adults spend an average of 56 minutes daily on TikTok (212)
Average TikTok video length: 42.7 seconds in 2024 (195)
LinkedIn
LinkedIn is the dominant B2B channel — no close second.
Over 1.2 billion members across 200 countries (33)
310 million monthly active users (108)
89% of B2B marketers use LinkedIn for lead generation; 62% say it produces leads effectively (174)
LinkedIn drives approximately 80% of all B2B social media leads (18)
4 out of 5 LinkedIn members drive business decisions (19)
25% of LinkedIn user households earn $100,000 or more a year — the highest income tier among LinkedIn users (130)
42% of marketers reported using LinkedIn in 2025 — up 11% from 2024 (81)
Average LinkedIn post engagement: ~1.74 interactions in 2025, up from 1.57 in 2024 (194)
Videos get shared 20x more than any other content format on LinkedIn (97)
Long-form articles receive 7x more views than short posts (115)
Posts with images receive 98% more comments than those without (97)
🎧 LinkedIn is where most B2B authority gets built — but very few people know how.
56% of social media marketers plan to increase video activities on Instagram in the next 12 months (166)
91% of businesses use video as a marketing tool in 2026 (233)
Social Commerce Is Still Gaining Ground
74% of marketers rate the integration of social commerce as somewhat or very important for 2025 (171)
80% of social media marketers believe consumers will buy products directly in social apps more often than on brand websites (81)
26% of marketers plan to explore selling products directly on social media in 2026, including Instagram Shops (81)
37% of mid-market and 36% of enterprise marketers already use social media shopping tools (81)
19% of U.S. consumers start their shopping search on Facebook (61)
There are over 250 million Facebook Shops worldwide (188)
Gen Z Behavior Is Different
Gen Z is not just a younger version of millennial social media behavior. It is a structurally different usage pattern.
Gen Z comprises 25% of the U.S. social media audience, gravitating toward dynamic platforms like Instagram and TikTok and significantly shaping digital marketing strategies (159)
35% of Gen Z spend over four hours daily on social media (178)
Social media is the most preferred product discovery platform for consumers aged 18–44 (81)
96% of Gen Z use YouTube; 83% of Gen Z girls favor Instagram; TikTok's Gen Z female engagement is 76% vs. 60% male (124, 193)
Only four in ten Gen Z users still engage with Facebook (193)
38% of Gen Z find online ads annoying (207)
About 69% of consumers trust influencer recommendations more than traditional advertising (107)
Email Marketing Statistics
Email Delivers the Highest ROI
Email ranks #1 for ROI in HubSpot's marketing report; paid social is second (81).
Email marketing delivers $36 for every $1 spent. Some industries see returns as high as $45 per $1, retail, e-commerce, and consumer goods lead here (71, 41).
Email marketing has an overall ROI of 4,200% (101).
18% of companies achieve an ROI of $70 or more for every $1 invested in email (127).
75% of companies spending $100 or less per month on email report $21+ ROI per dollar (158).
87% of brands say email marketing contributes directly to business success (106).
Why Marketers Still Bet on Email
4 out of 5 marketers say they would rather give up social media marketing than email (101).
44% of marketing professionals say email is their most effective marketing channel (155).
50% of marketers identify email as the most impactful channel for acquiring new contacts (18).
Email ties with organic social as the #2 most used marketing channel, used by 40% of marketers (81).
75% of marketers plan to maintain or increase their email marketing investment in 2026 (81).
87% of businesses already use email as a content distribution channel (230).
81% of SMBs rely on email as their primary customer acquisition channel (123).
61% of consumers spend a viewing time of 8 seconds or more per email (71).
Email Usage, Send Timing and Frequency
4.55 billion email users globally in 2025, projected to reach 4.97 billion by 2028 (199).
392 billion emails will be sent per day in 2026; 424 billion projected by 2028 (203).
99% of email users check their inbox every single day (58).
78% of people check email before going to work (160).
58% of email users check email first thing in the morning (96).
Full-time workers spend an average of 2.6 hours per day on email, handling approximately 120 messages per day (73).
Over 70% of people across all age groups use an email service every month (37).
Best sending windows: 9–11 a.m. (primary) and 4–6 p.m., with secondary peaks at 8 a.m., 2 p.m., and 5 p.m. (128).
Best sending days: Tuesdays and Mondays. Worst days: weekends (128).
Sending once a month has the highest open rate at 28%; 2–4 emails per month is the next best (163).
26% unsubscribe because they receive too many emails; 21% unsubscribe because emails are irrelevant (109).
Average unsubscribe rate in 2025: 0.22%, more than double 2024's 0.08% (104).
Benchmarks: Open Rates, CTR, Deliverability
Open rate benchmarks:
The average email open rate in 2025 was 43.46%, slightly higher than the previous year (104).
Welcome email average open rate: 68% (123).
Newsletters: 40.08% open rate; triggered emails: 45.38% (75).
Personalized emails average open rate: 22.63% (84).
Emails with preheader text receive 18% higher open rates than emails without (74).
Image-based emails: 43.12% open rate (5).
CTR benchmarks:
Average email CTR across all industries: 2.62% (Mailchimp) / 3.25% (GetResponse) (75, 102).
Yet 70% of brands still fail to use personalization in their emails (225). The gap is not knowledge, it is execution.
The most effective email strategies: segmentation (78%), message personalization (72%), automation (71%) (106).
78% of marketers say subscriber segmentation is the single most effective email strategy (81).
Segmented email campaigns see 30% higher open rates and 50% higher CTRs than non-segmented sends (81).
Segmented email lists increase revenue by as much as 760% (132).
75% of marketers believe personalized email results in higher CTR (41).
Consumers who buy through targeted emails spend 138% more than those who don't receive email offers (132).
6 out of 10 email subscribers are motivated to buy based on targeted emails (132).
Only 53% of marketers incorporate even basic personalization, like including a recipient's name (81).
Automation Drives Revenue
Automated emails can generate 320% more revenue than manually sent emails (24).
80% of businesses say email marketing automation improves their lead generation efforts (120).
Abandoned cart emails average open rate 41.8% and convert at approximately 10.7%; multi-channel recovery (email + retargeting) can reclaim around 27.62% of abandoned carts (177).
60% of online shoppers make at least one purchase per month after receiving a marketing email (47).
44% of marketers use lifecycle emails to activate, engage with, and retain consumers (100).
A/B testing can increase email marketing ROI by as much as 37% (132).
36% of digital marketers want to create more automated emails in their strategy over the next year (100).
Brands with dynamic email content see 22% higher ROI versus those who never use it (5).
47% of email marketers use AI when creating email campaigns (71).
47% of B2B marketers plan to expand AI use in email marketing automation in 2025 (171).
Mobile Email
Mobile devices account for nearly 60% of all email opens (101).
50% of users will delete an email not properly optimized for mobile (105, 127).
Optimizing for mobile responsiveness leads to a 15% increase in mobile clicks (95, 103).
56% of marketers implement mobile-friendly emails in their strategy, leaving 44% behind (71).
Nearly 1 in 5 email campaigns are not optimized for mobile devices (214).
B2B Email: Different Behavior, Same Channel
50% of B2B marketers identify email as the most effective channel in their multi-channel approach (95).
77% of B2B buyers prefer to be contacted via email over any other channel (133).
B2B email open rates average 36.7% in 2025, up from 34.2% in 2024, and reach as high as 42.35% in professional services (176).
67% of B2B buyers and consumers maintain a separate junk email account to avoid unwanted emails (83).
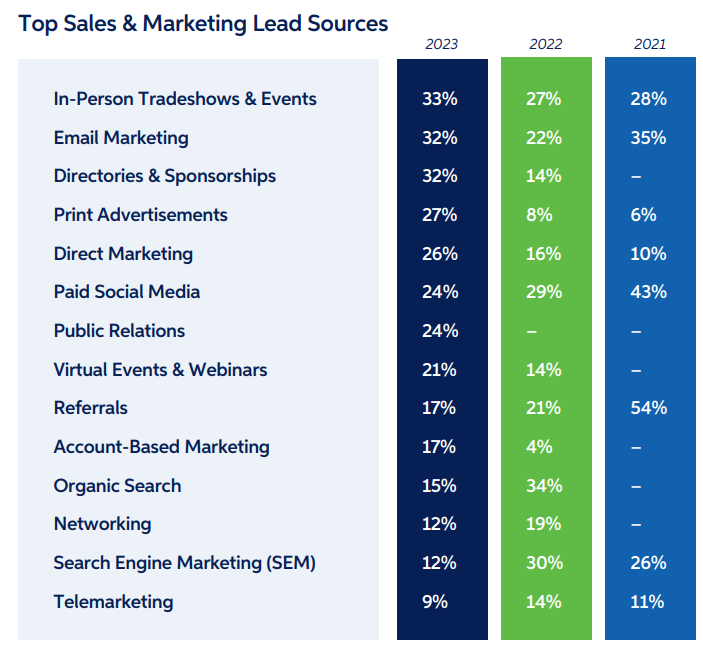
Email was ranked second for most effective sales/marketing lead source in B2B at 32% (144).
Figure 12. Top Sales & Marketing Lead Sources for B2B Companies (2021–2023). Source: Sagefrog Marketing Group (144)
Lead Generation Statistics
The State of Lead Generation
61% of marketers identify generating leads as their biggest challenge. (47) 34% rank it as their top marketing priority. (47) The global lead generation industry is projected to reach $295 billion by 2027 at a 17% annual growth rate. (18)
The average B2B website converts around 2.23% of visitors into leads. (18) Approximately 20% of marketing-generated leads eventually result in a sale. (18) Organizations generate roughly 1,877 leads per month on average. (18)
The pipeline math looks fine. The quality math does not.
68% of B2B marketers say increasing lead quality — not volume — is their primary goal (18)
Over 60% of marketers say customer acquisition costs have increased in the past three years (110)
42% of B2B companies cite lead quality as their top challenge (168)
67% of the B2B buying journey now happens online before a prospect ever speaks to sales (18)
Only 56% of B2B companies verify or validate leads before passing them to sales (18)
Why Most Leads Never Convert
79–80% of leads never convert into a sale. (47) The most common reasons are poor nurturing and misqualification. 44% of sales reps never follow up with a lead at all. (47)
Companies that invest in structured lead nurturing generate 50% more sales-ready leads at 33% lower cost. (90) Nurtured leads make purchases 47% larger than non-nurtured ones. (47)
There are 9x more chances of converting a lead when follow-up happens within 5 minutes. Yet 42% of sales reps report being too busy to respond that quickly. (18) The hour-level data makes it starker: following up within the first hour yields 53% conversion; waiting more than 24 hours drops that figure to just 17%. (31)
Companies with aligned sales and marketing teams report a 91% success rate in reaching target buying groups versus 74% for unaligned organizations. (18)
Where leads actually disappear:
73% of B2B leads are not ready to purchase on first interaction (112)
50% of leads that convert do so more than 90 days after the initial prospecting email (169)
28% of all prospecting leads come from the first follow-up email alone (169)
1 in 5 businesses has six or more people in their decision-making unit (169)
The buying committee is bigger, the timeline is longer, and the handoff between marketing and sales is where qualified leads quietly die.
🎧 Most leads don't fail at the form fill — they fail at qualification.
Listen to our podcast episode: B2B Intent Signals: The 4-Ingredient Framework — turn buyer signals into pipeline before competitors notice.
Lead Qualification: MQL-to-SQL Benchmarks
Most lead generation programs measure volume. The programs that actually drive revenue measure conversion quality — specifically, how many marketing-qualified leads become sales-qualified.
The average MQL-to-SQL conversion rate across all B2B sectors is 13%. (31) Top performers reach up to 40% — but they get there through behavioral scoring, tight SLAs, and regular qualification audits, not by running more ads. (31) B2B SaaS companies using behavioral lead scoring specifically achieve 39–40% MQL-to-SQL conversion rates — more than three times the average. (31)
Funnel benchmarks:
Overall average MQL-to-SQL rate: 13%; top performers reach 40% with advanced scoring (31)
B2B SaaS companies using behavioral scoring: 39–40% MQL-to-SQL (31)
34% of qualified leads get lost between departments due to poor tracking systems (31)
If you are generating volume but not moving MQLs to SQLs, the bottleneck is almost always the scoring model or the handoff process — not the top of funnel.
Cost Per Lead by Channel
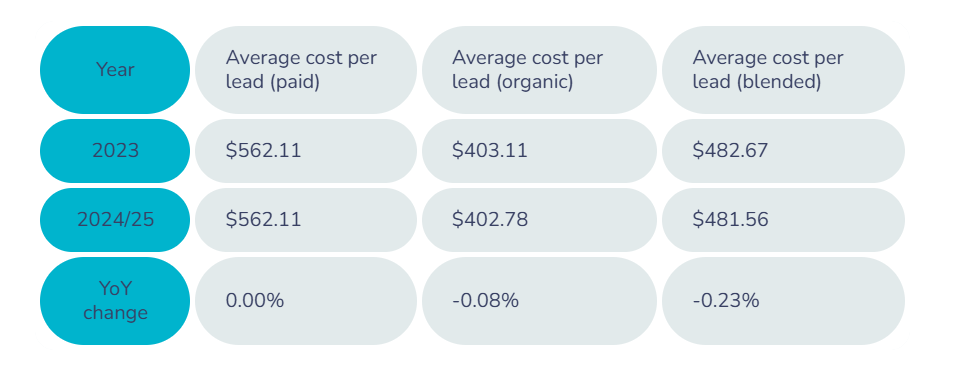
The average B2B blended CPL across all channels is approximately $481. (168)
Figure 13. B2B Average Cost Per Lead by Acquisition Type (2023 vs. 2024/25). Source: Sopro (168).
By channel: trade shows ($840), PPC ($463), LinkedIn Ads ($408) (168); SEO ($206), cold email ($225) (168); referrals ($25). (168)
Marketing channel
Average CPL
Low CPL
High CPL
Trade shows and in-person events
$840
$180
$1,500+
PPC
$463
$175
$751
Paid LinkedIn advertising
$408
$15
$800+
Cold calling
$300
—
—
Webinars
$267
$33
$500
Direct mail
$250
—
—
Cold emails
$225
$150
$300
SEO
$206
$14
$397
Multi-channel prospecting
$188
$80
$296
Paid Facebook advertising
$142
$102
$182
Affiliate marketing
$73
$54
$92
Referrals
$25
—
—
Table 3.B2B Cost Per Lead Benchmarks by Marketing Channel. Adapted from Sopro, "B2B Cost Per Lead Benchmarks by Channel and Industry (2025 update)" (168).
Referrals are the most cost-effective B2B lead source at approximately $25 CPL. (168) SEO organic leads average $206, making it the best-value scalable channel for most B2B companies. (168)
Organic beats paid on CPL in 29 of 30 industries tracked (Staffing & Recruiting is the lone exception) — and organic leads skew lower-funnel, arriving with more intent and less education needed. (69) The trade-off is time: organic requires an extended runway before results compound.
By industry: Higher Education has the highest CPL at $982. eCommerce is the lowest at $91. (69) Software Development averages $595. IT and Managed Services average $501. (168)
For B2B SaaS specifically, blended CPL averages $237 (paid: $310 / organic: $164). (69) Company size shifts the number too: companies with 51–200 employees pay $180 CPL on average; companies with 1,000+ employees pay $348. (168)
Channel ROI comparison:
LinkedIn Ads deliver 113% return on ad spend for B2B (168)
Google Ads: 78% ROA; Facebook Ads: 29% ROA (168)
Multi-channel B2B marketing campaigns generate 31% more leads than single-channel approaches (168)
90% of B2B marketers using LinkedIn Lead Gen Forms report lower CPL from reduced friction (47)
The channel ROI data makes a strong case for LinkedIn-first paid strategy in B2B. The 31% multi-channel uplift means no single channel should run in isolation.
Best Channels for Lead Quality
57% of B2B marketers say SEO generates more leads than any of their other marketing initiatives. (92) Content marketing costs approximately 62% less per lead than traditional outbound methods. (40)
73% of B2B marketers say webinars produce the best quality leads of any channel. Average webinar attendance rate is 44% of registered participants, with average viewing time of 51 to 52 minutes. (18)
LinkedIn drives approximately 80% of all B2B social media leads. (18) 40% name it the most effective channel for acquiring high-quality leads. (170)
Email rounds out the top channels — not for volume, but for lead quality.
59% of marketers say email is at least twice as effective for lead generation as PPC or social ads (47)
78% of companies use email for lead generation; 42% say it is their most important lead gen channel (18)
Brands with an active blog generate 68% more leads than those without; 76% of businesses credit content marketing with higher lead volume (47)
The pattern is consistent: organic channels (SEO, content, email) produce better-quality leads at lower cost. Paid channels produce faster volume at higher cost. The highest-performing programs run both.
AI and Automation in Lead Generation
AI is changing lead generation at the qualification layer — not the top of funnel, but the MQL-to-SQL conversion step where most programs lose the most value.
Companies using AI for lead generation report up to 50% more sales-ready leads (18)
AI tools reduce customer acquisition costs by up to 60% (18)
80% of marketers say marketing automation generates more leads and conversions (18)
AI-powered tools cut false MQL classifications by 40% using historical data patterns (31)
Automated lead grading improves SQL accuracy by 43% in SaaS companies (31)
The biggest unlock is not AI-generated outreach. It is AI-powered qualification. Getting the 13% average MQL-to-SQL rate closer to 30–40% is where the ROI actually lives.
Video Marketing Statistics
TL;DR: Video is the highest-performing content format across almost every metric. Short-form leads on ROI. Long-form wins on depth. The question is no longer whether to use video. It is which type for which funnel stage.
The State of Video Marketing
91% of businesses now use video as a key marketing tool. (14) Video content was projected to account for 82% of all web traffic by end of 2025. (220) Online videos reached 94.6% of internet users worldwide in Q2 2025. (187) This is not a niche channel — it is the default medium of the internet.
93% of marketers recognize video as a crucial component of their strategy (14)
83% of marketers say video has a direct positive impact on sales (14)
92% of businesses say they are satisfied with the ROI of their video marketing on social media (14)
82% of video marketers say video gives them a good ROI — though this is down 11% from the previous year (233)
People spend an average of 17 hours per week watching videos online (205)
Over 60% of the global online population now watches short-form "swiping" video content (TikTok, YouTube Shorts, Instagram Reels) every day (4)
The direction is clear even where the numbers soften. ROI satisfaction is still above 80% — the drop signals growing competition, not a failing format.
Short-Form vs. Long-Form: What the Data Says
Short-form video has the highest ROI of any content format. Long-form video wins on search rankings and depth of comprehension. They are not competing formats — they serve different funnel stages.
Short-form video is the most leveraged media format by marketers and delivers the highest ROI (81)
Top 3 ROI-driving content formats: short-form video (49%), long-form video (29%), live-streaming video (25%) (81)
Short-form video delivers the highest ROI for 21% of marketers; static images follow at 19%; live-streamed video at 16% (154)
73% of consumers prefer to watch a short-form video to learn about a product or service (218)
Short-form video is rated 80% effective and long-form video 83% effective by influencer marketers — both outperform static content (86)
Short-form video (15–30 seconds) is preferred by 53% of influencers for brand collaborations (172)
The exception is SEO: the first-page YouTube search results average 14 minutes and 50 seconds. Long-form video wins on search. Short-form wins on social feeds.
Platform engagement rates for short-form in Q1 2024 (according to HubSpot):
YouTube Shorts: 5.91% average engagement rate — highest of all short-form platforms (81)
TikTok: 5.75% (81)
Facebook Reels: ~2% (81)
YouTube: The Giant Worth Understanding
YouTube is the world's second-largest search engine and the most widely used video marketing platform. 82% of video marketers use it. (233) Nearly 2.7 billion people are monthly active users. (76) 70 billion YouTube Shorts are viewed every single day. (46)
YouTube helps 90% of users discover new brands or products (175)
Over 40% of YouTube users have purchased products they discovered on the platform (224)
Users spend an average of 40 minutes per session (34)
Mobile accounts for 69% of all YouTube video consumption (232)
67% of marketers plan to increase their use of YouTube in 2026 (81)
Video Advertising: Where the Money Is Moving
U.S. digital video ad revenue jumped 25.4% to $78 billion in 2025, making it the fastest-growing major ad format. (150) Global digital video ad spending is projected to reach $236 billion in 2026 and over $268 billion by 2029. (81)
41% of marketers spent money on video ads in 2025, up 5% from 2024 (233)
TikTok ad revenue grew from $4 billion in 2022, projected to double by 2024 and nearly quadruple by 2026 — making it one of the fastest-growing video ad platforms (192)
YouTube ads average cost-per-view of $0.010–$0.030; reaching 100K viewers costs approximately $2,000 (85)
Video ads on Instagram see 38% higher engagement rates than image posts (15)
Promoted tweets with video content are 10x more engaging than those without (234)
The spend growth is platform-agnostic. Video ad budgets are moving across YouTube, TikTok, Instagram, and CTV simultaneously — not concentrating in one place.
Video for Lead Generation and Conversion
Video does not just build awareness. It converts. 88% of marketers say video marketing helps generate more leads. (47) Adding video extends average user time on site by 88%, and websites with video achieve average conversion rates of 4.8% versus 2.9% for non-video sites. (223)
Marketers get 66% more qualified leads through video marketing (14)
96% of people say they watch explainer videos to learn more about a product; 85% report being convinced to purchase (81)
51% of consumers rely on product videos to make a purchase decision (131)
96% of marketers agree that videos help users understand products and services (14)
57% of video marketers say video has decreased the number of support queries they receive (233)
53% of B2B marketers believe video content will have the greatest impact on content marketing success in the coming years — more than any other format (171)
The support query stat is underrated. Video that educates at the top of the funnel reduces operational costs at the bottom.
Video SEO
Web pages that include video earn 157% more inbound links and generate significantly higher search traffic than text-only pages. (10) YouTube itself is the second-largest search engine in the world — and it shows up in 19.8% of top 10 organic Google search results. (154)
Long-form wins in search: first-page YouTube results average 14 minutes and 50 seconds. (10) That is not accidental — YouTube's algorithm rewards watch time, and longer video drives it. The implication is that short-form and long-form video need separate SEO strategies, not a single one.
Production Challenges and AI
The biggest barrier to video is not belief — it is execution. 48% of content marketers say their organization is not using existing video assets to their full potential. (189)
43% cite lack of in-house filming and editing skills as their top video challenge (189)
40% say lack of a dedicated video budget is their biggest barrier (189)
51% of video marketers now use AI tools to create or edit marketing videos (154)
AI is closing the production gap. Teams that previously could not afford video at scale are now producing it with AI-assisted editing, scripting, and voiceover — at a fraction of the cost. The skills barrier is eroding faster than most marketing teams realize.
Conversion Rate and ROI Statistics
TL;DR: Conversion rates are falling industry-wide. The gap between average performers and top performers is wider than it has ever been. UX investment and structured CRO programs consistently deliver strong returns.
Industry Benchmarks
Overall website conversion rates dropped 6.1% in 2025. (68) The cost to acquire a single website visit jumped 9% year-over-year. (68) The average web conversion rate across all industries sits at approximately 2.9%. (177)
The problem is not just the headline number — it is the distribution. The cross-industry median landing page conversion rate is 2.35%. The top 25% of pages convert at 5.31% or higher. (94) The gap between average and good is more than 2x. The gap between average and top is not a rounding error.
B2C average conversion rate: approximately 2.1%; B2B: 1.8%; B2B SaaS: 1.1% — the lowest baseline of any measured segment (177)
Conversion Rate Optimization is the second most used optimization technique among marketers, used by 50% — one percentage point behind audience segmentation (81)
Only 39.6% of companies have a fully documented CRO strategy (177)
Firms that do use CRO tools report an average ROI of 223% (177)
Most companies are leaving conversion gains on the table not because the tactics do not exist — but because they have not built a systematic program to apply them.
Landing Page Benchmarks by Industry and Type
Not all landing pages are equal. The average landing page conversion rate across 18 industries is 10.76% — but this is pulled up significantly by email opt-in pages. (94) When you strip those out, the numbers tell a more grounded story.
By industry:
B2B SaaS landing pages: 1.1% average — the lowest of any industry tracked (94)
B2B services (general): 3.6%; B2C: 3.9% (94)
Lead generation landing pages: 9–12% average; best performers reach 20–30% (94)
Webinar registration pages: 22.84% average; top performers reach 50–60% (94)
By content type:
White papers: 4.6% conversion; case studies: 3.5%; landing pages: 3.1% (154)
By traffic source:
Paid search drives the highest overall landing page conversion rate at approximately 3.2% (94)
Organic search averages 2.7%; referral traffic 2.9%; email traffic 2.6%; social media traffic just 1.5% (94)
B2B SaaS from paid search averages only 1.5% — even below the organic average (94)
The webinar registration benchmark stands out. For B2B marketers targeting a professional audience, a well-crafted webinar page outperforms almost everything else by a factor of 5 to 10x.
Page Speed and Mobile
Page load speed has a direct impact on conversion. At load speeds under 1 second, conversion rates average 31.79%. At 5 seconds, they drop to 9.68%. (94) That is a 70% relative drop from a difference most users would barely notice.
The granular data is sharper:
A 1-second delay in page load time leads to up to a 7% decline in conversions; the decline averages 4.42% per second across the first 5 seconds (177)
Walmart found that speeding pages by just 1 second yielded a 2% boost in conversions (177)
B2B sites loading in 1 second convert at approximately 3 times the rate of those loading in 5 seconds (177)
Reducing page load time from 8 to 2 seconds increases conversions by 74% (220)
Speed is not a technical concern. It is a revenue concern.
Cart Abandonment
The global cart abandonment rate is approximately 70–75.6%, rising to 85.65% on mobile. (177) $18 billion in annual retail revenue is lost to cart abandonment. (177) In the US and EU alone, $260 billion worth of purchases are abandoned due to poor checkout design. (223)
Why people abandon:
48% abandon because of unexpected costs — shipping, taxes, handling fees added at the last step (177)
26% abandon because the site forces account creation before checkout (177)
22% abandon due to a checkout process that is too long or complex (223)
The recovery opportunity:
Abandoned cart emails see average open rates of 41.8% and convert at approximately 10.7% (177)
Multi-channel recovery (email plus retargeting) can reclaim approximately 27.62% of abandoned carts (177)
Large e-commerce sites can achieve a 35.26% conversion rate increase through better checkout design alone (68)
The abandonment causes are almost entirely self-inflicted. Unexpected fees and forced registration are design decisions, not market forces.
CRO Tactics That Move the Needle
The gap between average and top-performing pages is not luck — it is specific, measurable practices applied consistently.
Social proof is the single highest-leverage element:
Displaying reviews can increase conversion rates by up to 270% (177)
Products with existing reviews convert 12.5% higher than products without (177)
93% of consumers say online reviews influence their purchase decisions; 94% say negative reviews caused them to reject a brand (177)
Social proof placed below a CTA increases conversion rates by 68% (94)
CTAs and personalization:
Personalized CTAs perform 202% better than generic ones (94)
Personalized CTAs yield approximately 42% higher conversion than generic CTAs (177)
AI personalization is now the most used CRO technique, cited by 28.2% of marketers; A/B testing follows at 24.1% (177)
AI-powered CRO platforms report average conversion lifts of approximately 25% for adopters (177)
Other high-impact tactics:
Only 1 in 8 A/B tests produces a statistically significant result — meaning a rigorous testing culture requires high volume and patience (94)
Testing is not a silver bullet. But systematic, high-frequency testing is the only repeatable path to reaching the top 25%.
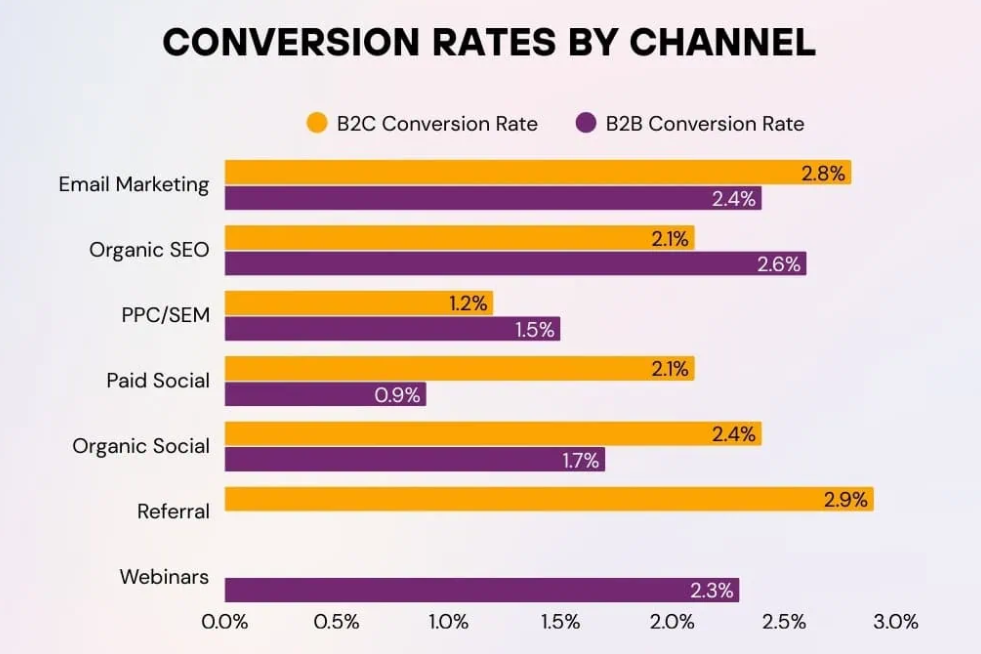
Channel Conversion Rate Comparison
Different channels convert at very different rates. Knowing which channel converts best for your model changes where you put budget.
In B2B, by channel conversion rate:
SEO (organic search): 2.6% — highest channel conversion rate for B2B (177)
Email marketing: 2.4% (177)
Webinars: 2.3% (177)
PPC/SEM: 1.5% (177)
Social media: approximately 1.0% (177)
Display advertising: 0.7% (177)
Figure 14. Conversion Rates by Channel: B2B vs. B2C. Source: SQ Magazine (177).
One emerging outlier: traffic referred from AI platforms (ChatGPT, Perplexity, Claude, Gemini) converts 4.4x better than traditional organic search. ChatGPT's conversion rate is 15.9%, Perplexity 10.5%, versus Google organic at 1.76%. (134) AI-referred visitors arrive with a higher level of intent and specificity — they have already been filtered through a conversational query.
ROI by Channel
Email: $36 for every $1 spent. (71) SEO leads close at 14.6% versus 1.7% for outbound. (52) PPC visitors are 50% more likely to convert than organic traffic. (230) Content-led brands see conversion rates up to 6x higher than non-content brands. (111)
Every $1 invested in UX design yields $100 in return — a 9,900% ROI. (223) Well-designed UI can increase conversion rates up to 200%. (177) Allocating 10% of development budgets to UX produces an 83% conversion rate improvement. (223)
These are not marketing statistics. They are investment thesis statements.
UX Investment ROI
UX investment is not a design budget item — it is a revenue recovery mechanism. The e-commerce industry loses approximately $1.42 trillion annually due to inadequate user experience. (223)
88% of users will not return to a website after a poor experience (177)
52% of consumers stopped using a brand after just one bad experience in 2025 (68)
49% of consumers have left brands due to poor UX (113)
72% of users will recommend a positive web experience to more than 5 people; 13% of people discuss unfavorable experiences with 15 or more people (223)
Improving customer retention by just 5% through better UX translates to a 25% profit increase. (113) The UX services market is projected to grow from $2.59 billion in 2022 to $32.95 billion by 2030. (220) The industry is pricing in the ROI.
CAC Trends
Customer acquisition costs have risen by approximately 60% over the past five years. (18) Over 60% of marketers say their CACs have increased in the past three years alone. (110) The cost of reaching a customer is going up and the conversion rate at the end of that journey is going down.
AI tools reduce customer acquisition costs by up to 60% for companies that have implemented them at scale. (18) The mechanism is efficiency — better targeting, faster qualification, reduced spend on unqualified traffic.
The math is simple: fix conversion first, then worry about volume. Sending more traffic to a leaking funnel just fills a leaking bucket faster.
Marketing Automation and AI Statistics
TL;DR: AI adoption moved from early majority to near-universal in 2025. But most organizations are still in the experimentation phase, not the implementation phase. The ROI gap between AI leaders and laggards is growing fast.
Adoption Rates
80% of marketers feel pressure to adopt AI. (213) 89% say that pressure comes from the C-suite or board of directors. (213) Yet only 6% have fully embedded AI into their workflows. (213) 39% are still in the "experimenting" phase. (213)
The scale of adoption is real — it is the depth that is shallow:
The global AI market is expected to grow from $114.33 billion in 2025 to $619.77 billion by 2034 at a 20.66% CAGR. (140)
Generative AI tools now have approximately 2.42 billion monthly active users — roughly 30% of the global population; GenAI adoption nearly doubled in the past 12 months, adding approximately 1.4 billion new users (35)
75% of Americans now use AI-powered search tools weekly; 40% use AI chatbots at least monthly (134)
95.4% of B2C marketers now use AI in some form — up from 77.2% just one year prior (119)
75% of businesses use marketing automation technologies (2)
92% of marketing agencies invest in marketing automation tools (18)
94% of marketers plan to use AI in their content creation processes in 2026 (81)
Near-universal adoption with near-zero full implementation. The gap between "using AI" and "embedded AI" is where most of the performance upside still lives.
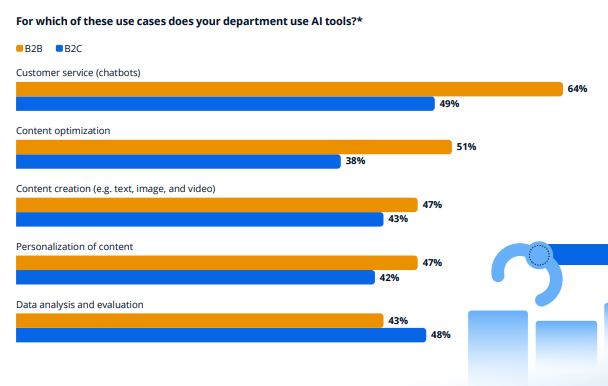
What AI Is Actually Used For
Knowing that people use AI is less useful than knowing what they use it for. The use case distribution tells a different story than the headline adoption numbers.
How marketers currently deploy AI:
80% of marketers use AI for content creation; 75% use it for media production (81)
93% use automation for administrative tasks — scheduling, note-taking, documentation (81)
92% use automation for data analysis and reporting (81)
64% of B2B marketers apply AI for customer service via chatbots — the most common B2B use case (171)
51% apply AI for content optimization (171)
47% for content creation specifically; 47% for personalization of content (171)
43% for data analysis and evaluation (171)
Figure 15. AI Tool Use Cases by Marketing Department: B2B vs. B2C Adoption. Source: Statista (171).
The most common AI applications in content marketing specifically:
Idea generation and editing: 66% of content marketers (154)
Headline writing: 58% (154)
Outlining: 54% (154)
Top B2C use cases: content creation (57%) and email optimization (53.4%) (119)
For tools, the most popular AI applications are visual: smart image editing tools (45%), video or animation generators (44%), smart video and audio editing tools (42%). (81) The adoption of manual spreadsheets for marketing work fell from 20.8% to 6.9% in a single year. (119)
What AI Actually Delivers
AI-driven personalization increases user engagement by 80%. (220) AI automates 70% of customer interactions in high-volume businesses and saves $2 billion annually in customer support costs. (220)
Companies using AI for lead generation report up to 50% more sales-ready leads. (18) AI tools reduce customer acquisition costs by up to 60%. (18) Marketing automation generates more leads and conversions according to 80% of marketers. (18)
Measured outcomes across the funnel:
77% of marketers say AI helps personalize content and results in better-quality output (13)
65% of companies have seen better SEO results after adopting AI tools (50)
AI-powered tools cut false MQL classifications by 40% using historical data patterns; automated lead grading improves SQL accuracy by 43% in SaaS companies (31)
85% of creative leaders say they reclaim at least 4 hours per week using AI tools (68)
AI-driven email campaigns lead to a 13% increase in CTR and a 41% rise in revenue (227)
The ROI is not hypothetical — it is measurable. The organizations pulling ahead are not doing more with AI; they are doing it more systematically.
Marketing Automation: By the Numbers
Marketing automation is the operational layer beneath AI. It handles the volume, timing, and sequencing that no human team can manage at scale.
The market reflects the priority: the marketing automation market was valued at $8.23 billion in 2024 and is projected to reach $21.7 billion by 2032. (216)
76% of brands used marketing automation in some form in the past year (230)
91% of marketers believe that marketing automation is essential for nurturing leads (43)
82% of marketers say they want AI to help reduce repetitive tasks within their marketing technology stack (216)
47% of marketers report leveraging automation specifically to make marketing processes more efficient (81)
80% of businesses say email marketing automation improves their lead generation efforts (120)
Automation is where the efficiency gains become durable. A one-time AI prompt is a tactic. An automated workflow is a system.
AI and Chatbots
Chatbots have moved from novelty to infrastructure. They are now the most common AI application in B2B marketing — ahead of content generation and personalization.
58% of B2B companies now use chatbot software (18)
55% of those using chatbots report an increase in high-quality leads (18)
64% say AI chatbots helped generate more qualified leads (18)
82% of consumers prefer an immediate chatbot response over waiting for a human (18)
AI personalization is now the most used CRO technique, cited by 28.2% of marketers (177)
AI-powered CRO platforms report average conversion lifts of approximately 25% for adopters (177)
In the AI chatbot market itself, ChatGPT holds 78.16% share, followed by Google Gemini at 8.65% and Perplexity at 7.07%. (78) The market is concentrated, but the applications are fragmented across every function in the stack.
The Barriers: Trust, Privacy, and Integration
Only 1% of marketers have complete trust in AI outputs. 17% report high trust. (213) 39% have concerns about AI data privacy. (213) The gap between adoption pressure and trust level is one of the defining tensions in marketing right now.
The specific barriers, in order of frequency:
37% cite lack of a clear AI strategy from leadership as their biggest barrier to AI adoption (213)
35% cite insufficient training as a top barrier (213)
55% of B2B marketers cite data protection and security as the top challenge in using AI for content marketing (171)
51% cite integration into existing processes and systems as a barrier (171)
51% cite implementation costs (171)
51% cite quality of generated content as a challenge (171)
These are not excuses — they are structural gaps. The organizations that will pull ahead are the ones that address the strategy and training gaps first, because the technology itself is no longer the constraint.
Data Challenges Are Holding Teams Back
87% of marketers believe better data and analytics would improve their overall effectiveness. (213) Only 41% feel confident in their team's ability to analyze data effectively. (213) 37% cite lack of system integration as their primary data challenge. (213)
Data-driven organizations are 23x more likely to acquire customers and 19x more profitable than competitors. (113) Yet only 30% of marketers feel confident about their data connection capabilities. (213)
The most widely used marketing measurement methods in 2026: A/B testing (69%), ROI analysis (62%), budget vs. actual tracking (56%). (213) Marketing mix modeling (MMM) is the top measurement investment priority for 40% of marketers in 2026. (213)
The measurement gap is the data gap. Teams that cannot prove what works cannot defend their budgets — and in 2025, that is a compounding problem as AI generates more output that demands attribution.
The Skills Gap
AI adoption is outpacing AI literacy. 58% of companies see a need for further training in AI to remain future-proof in content marketing — the top-ranked skills gap in the industry. (171)
92% of marketing and creative leaders believe AI literacy will be mandatory within 2–4 years (68)
74% of marketers think most people will be using AI in their workplaces by 2030 (11)
Only 47.18% of marketers say they understand how to incorporate AI into their marketing strategy (81)
Only 47.63% say they know how to measure the impact of AI in their digital marketing efforts (81)
The organizations building AI training programs now are not being cautious — they are being strategic. The ROI on AI skills compounds faster than almost any other investment a marketing team can make.
Mobile Marketing Statistics
TL;DR: Mobile is not a channel. It is the primary surface on which most digital marketing is experienced. Brands that are not mobile-first are not fully in the game.
The Mobile-First Reality
The numbers settle the debate. There are 5.83 billion unique mobile users worldwide — 70.4% of the global population — with 7.648 billion smartphones in active use. (35) Mobile devices account for 51.6% of total global web traffic. (35) 96.2% of users access the web via mobile. (56)
People spend an average of 5 hours and 16 minutes per day using mobile devices (154)
98% of Americans use a mobile device (129)
90% of mobile time is spent within apps rather than the mobile browser (220)
Mobile marketing is the fastest-growing digital channel by revenue (64)
Smartphones account for around 75% of global retail site traffic and generate 71% of online shopping orders (Q4 2025) (204)
This is the baseline. Every other marketing channel — search, social, email, video, ads — is primarily consumed on a 6-inch screen.
Mobile Advertising
Mobile advertising expenditure is expected to exceed $216 billion in 2025. (16) Mobile advertising accounted for 77% of all digital ad spend in 2024. (230) Global mobile revenue share of the digital advertising market is forecast to reach 69.61% by 2028 — its ninth consecutive year of growth. (183)
53% of all PPC clicks come from mobile devices (49)
The U.S. leads the world in mobile ad spending at over $233 billion annually (182)
China is the second-largest mobile advertising market at nearly $163 billion (182)
Consumers are 35 times more likely to open mobile messages than emails (230)
The channel allocation has already shifted. Mobile is not where budgets are moving — it is where they have moved.
Mobile Commerce
Mobile devices accounted for 51.4% of online sales in October 2025, up 11.6% year-over-year. (68) Mobile generated 70% of all orders globally during Cyber Week 2025. (68) The majority of e-commerce has crossed the mobile threshold.
Shopping behavior on mobile:
90% of smartphone users will continue shopping when they experience positive mobile interactions (223)
74% of users say they are more likely to return to a mobile-optimized website (18)
67% of mobile users are more likely to purchase from a mobile-friendly website (18)
8 out of 10 users stop interacting with content that displays poorly on their device (223)
67% of mobile users identify small clickable buttons as a major shopping obstacle (223)
40% of U.S. mobile sites fail to support common gestures like pinch-to-zoom for product images (223)
Where mobile commerce falls apart is almost always friction — unexpected costs, tiny tap targets, and checkout flows built for a keyboard and mouse. Fix those, and the conversion gap narrows fast.
Mobile Search
70% of searches made on mobile phones lead to an online action. (143) Google dominates mobile search globally with a 94.35% market share. (154) 66.75% of all mobile search traffic is driven specifically through Google Chrome. (137)
88% of users who search for a local business on a mobile device call or visit a store within 24 hours (215)
61% of mobile users are more likely to contact a local business if their website is mobile-friendly (77)
63% of people in the U.S. searched for more information about a product or service on a mobile app specifically (81)
Voice assistant usage on smartphones is forecast to rise to 48.7% of internet users by 2029 (60)
Local search on mobile is essentially a purchase-intent signal. A user searching "near me" on a phone is not browsing — they are deciding.
Mobile UX: Where Brands Fail
85% of users expect mobile websites to match or exceed desktop site quality. (223) 96% of users have already encountered websites poorly optimized for mobile. (223) The expectation is universal. The execution is not.
The bounce rate gap is structural:
The average mobile bounce rate rose 54% in 2025 alone (68)
Mobile bounce rate averages 67.4% versus 32% on desktop (113)
Mobile users are approximately 5 times more likely to abandon a site that is not mobile-friendly (177)
Over 50% of landing pages are not fully optimized for mobile, even as mobile drives 70%+ of visits (177)
35% of websites fail basic Core Web Vitals on mobile devices (153)
The performance data shows exactly where it costs:
62% of companies report increased sales after mobile website optimization (223)
Mobile-optimized sites achieve up to 40% higher conversion rates than non-optimized versions (223)
On mobile, each additional second of load time may reduce conversions by as much as 20% (177)
Mobile Apps vs. Mobile Web
Mobile apps have 157% higher conversion rates than mobile websites. (220) This is the single most important benchmark in mobile marketing. If you have a product that supports an app, the conversion argument for building and maintaining it is settled.
90% of mobile time is spent within apps (220)
Among B2C marketers, mobile website (58%) and mobile app (51.6%) are both in the top 5 channels by usage (119)
Mobile apps referencing AI in their name or description now generate 17 billion downloads worldwide — up from 5 billion in 2019 (154)
ChatGPT is the most downloaded mobile app globally with 903 million downloads (154)
The app advantage is not about features. It is about the persistent, low-friction relationship an app creates with users. A saved session, push notifications, and no load time are structural conversion advantages that a mobile website cannot replicate.
Mobile Messaging
Mobile messaging is under-invested relative to its reach and ROI. There are over 3 billion active users on messaging apps worldwide. (65) 79% of consumers opted in to receive texts from businesses in 2024. (157) That opt-in rate alone signals intent.
WhatsApp as a popular marketing channel more than doubled among B2C marketers, from 13.5% to 34.8% in a single year (119)
14% of marketers currently use mobile messaging in their strategy (81)
10.5% of marketers say messaging is one of their biggest ROI drivers (81)
14% name mobile messaging as one of the best use cases for segmentation and personalization (81)
The combination of high opt-in rates, direct delivery, and low competition within the inbox makes messaging one of the most structurally underused channels in B2B and B2C marketing. The 14% adoption number is not a signal of low value — it is a signal of a gap.
Web Design Statistics
TL;DR: First impressions form in 0.05 seconds. Design quality directly determines whether visitors stay, engage, and convert. Investment in design is investment in conversion rate.
First Impressions and Design Trust
Users form first impressions in just 0.05 seconds. (223) 75% of people judge a company's credibility based on its website design alone. (113) 94% of all website feedback relates to design — not content. (223)
Design is not packaging. It is the product of the first experience.
88% of users are unlikely to revisit a website after a negative experience (230)
52% of consumers stopped using a brand after one bad experience in 2025 (68)
38% of users stop engaging entirely with a site they find visually unattractive (230)
57% of internet users say they will not recommend a business with a poorly designed mobile website (231)
50% of consumers believe brands should prioritize web design as a core investment area (57)
The credibility signal flows in both directions. Poor design repels. Strong design builds trust before a single word is read.
Navigation and Why Users Leave
Most visitors who leave a website do not leave because of bad content. They leave because they cannot find what they came for.
61.5% of web designers identify inadequate navigation as the primary reason visitors abandon sites. (223) 61.5% of all website redesign projects are triggered by substandard user experience — not by visual rebrand. (223)
Where navigation fails:
70% of small business websites are missing a call to action on their homepage entirely (230)
90% of consumers will switch to a competitor after a poor website experience (230)
Over 90% of eCommerce sites fail to highlight the user's current location in primary navigation (223)
57% of eCommerce sites prevent users from using the back button during checkout — a major friction point (223)
Websites minimizing user frustration saw 4.5x less visitor churn (68)
Designs encouraging 10% more session depth see 5.4% higher conversion rates (68)
CTA Design and Layout
Where you place a CTA matters as much as what it says. Users allocate approximately 57% of their viewing time to content positioned above the fold. (223) 80% of viewing time goes to the left side of the page. (223)
CTAs positioned above the fold achieve 73% visibility versus 44% for below-fold placement (223)
Center-aligned CTAs attract 682% more clicks compared to left-aligned versions (223)
Personalized CTAs outperform standard versions by 202% (223)
The layout hierarchy is not a design preference — it is a conversion lever. Most CTAs underperform because they are placed where designers want them, not where users look first.
Responsive Design and Mobile Optimization
73% of users leave a website due to non-responsive web design. (57) 70% of web designers cite missing responsive design as the primary reason visitors abandon sites. (223)
The industry has largely responded. As of 2024, approximately 90% of websites have adopted responsive design principles. (223) Google ceased indexing non-mobile-accessible sites entirely as of July 2024 — making responsiveness a ranking requirement, not just a best practice. (223)
Responsive design boosts organic traffic by 62% and reduces bounce rate by approximately 30% (223)
The 10% of websites still not fully responsive are not just leaving conversions behind — they are invisible to Google's mobile-first indexing.
Page Performance and Core Web Vitals
88.5% of web designers believe the top reason visitors leave a website is because it loads too slowly. (57) They are right.
Only 54.6% of websites meet Core Web Vitals thresholds as of November 2025. (154) On mobile specifically, the numbers are worse:
Median mobile homepage weight reached 2,362 KB as of July 2025 — a 202% increase from 2015 (68)
Median mobile page loads 632 KB of JavaScript alone (68)
Page bloat is the root cause. Sites built on modern JavaScript frameworks often ship far more code than users need to see the first screen. The gap between what page builders add and what Core Web Vitals require is widening, not closing.
Accessibility
94.8% of the top 1 million homepages failed WCAG accessibility standards in 2025. (68) Low contrast text affects 79.1% of homepages. (68) Shopping sites average 71.2 accessibility errors per page. (68)
These are not fringe failures — they are the norm.
70% of the U.S. population benefits from accessible technology, up from 57% in 2003 (68)
Organizations with highly supportive executives on accessibility are 7 times more likely to see revenue gains from accessibility programs (68)
39% of users are drawn to color more than any other visual element when visiting websites — making contrast a direct engagement factor, not just a compliance issue (28)
Accessibility is increasingly a business case, not only a legal one. The 7x revenue multiplier for organizations that treat accessibility seriously reframes it entirely.
Typography, Color, and Imagery
Visual decisions compound. They build or undermine trust before any message is processed.
Nearly 75% of Fortune 500 companies use sans serif fonts in their corporate logos — the dominant choice for perceived modernity and legibility (223)
46% of users favor blue for business websites; 30% prefer green — color preference is not random, it tracks with category associations (223)
39% of users prioritize colors above all other visual website elements (223)
Over 65% of eCommerce websites use custom fonts for brand differentiation (223)
Original images drive 20% more engagement than stock photographs (223)
58% of designers now use AI to produce website images and media (223)
AI-generated imagery is entering the default design workflow. The implication is both an efficiency gain and a homogenization risk — when everyone uses the same models, differentiation requires more intentional creative direction.
The Business of Web Design
The global web design services market was valued at $61.23 billion in 2025. (68) The global web design industry as a whole is expected to expand to $100 billion by 2031. (223) The U.S. alone generated approximately $43.5 billion in web design revenue in 2024. (223)
The global UX services market is projected to grow from $2.59 billion in 2022 to $32.95 billion by 2030 — a 37.8% CAGR (220)
Web design roles are projected to grow 7% from 2024 to 2034 (68)
The U.S. employed over 222,600 web designers as of 2023 (223)
Median annual wage for web designers reached $98,090 in mid-2024 (68)
The market is expanding because the consequences of poor design are now measurable in revenue, not just aesthetics. Every statistic in this chapter is an argument for that investment.
Marketing Technology (MarTech) Statistics
TL;DR: The MarTech landscape has exploded from 150 tools in 2011 to more than 15,000 today. The challenge is no longer finding tools. It is selecting fewer, better-integrated ones and actually using them.
How Big Is the MarTech Market?
The global MarTech market was valued at approximately $859 billion in 2025, projected to surpass $1.03 trillion by 2026. (216) Precedence Research values the market at $557.94 billion in 2025, growing to $3.29 trillion by 2035 at a 19.40% CAGR. (135) The range between sources reflects different scope definitions — but both point in the same direction.
The number of MarTech solutions grew from just 150 in 2011 to 15,384 by 2025. (216) That is a 100x increase in 14 years. The marketing technology stack has become its own industry.
HubSpot dominates with a 34.72% market share in CRM and marketing software (216)
Social media tools hold the largest product segment at 22% of the MarTech market (135)
44% of U.S. marketing teams use four or more tools simultaneously (135)
North America holds 33% of the global MarTech market; the U.S. alone is projected to reach $779 billion by 2035 (135)
Asia Pacific is the fastest-growing region, driven by rapid digital adoption and expanding e-commerce infrastructure (135)
79–81% of B2C marketers planned to increase their MarTech investment in 2025 (119)
The ROI case for integration is not subtle. Brands with omnichannel MarTech strategies achieve 91% greater year-over-year customer retention and 287% higher purchase rates compared to single-channel approaches. (135) Tool count is not the variable. Connectivity is.
AI Is Reshaping the Stack
82% of marketers want AI to help reduce repetitive tasks within their technology stack. (216) 92% of marketing and creative leaders believe AI literacy will be mandatory within two to four years. (68) 85% of creative leaders already reclaim at least 4 hours per week using AI tools. (68)
The marketing automation market is projected to grow from $8.23 billion in 2024 to $21.7 billion by 2032. (216) That growth reflects a structural shift — automation is no longer a feature inside a platform; it is a category of its own.
AI's specific entry points into the stack:
80% of marketers currently use AI for content creation; 75% use it for media production (81)
AI personalization is now the most used CRO technique in the stack, cited by 28.2% of practitioners (177)
51% of video marketers use AI tools to create or edit marketing videos (154)
AI-powered tools cut false MQL classifications by 40%; automated lead grading improves SQL accuracy by 43% in SaaS companies (31)
The ROI is compounding faster at the integration layer than at the individual tool layer. Teams that connect AI outputs to CRM and attribution workflows outperform those using AI as a standalone content generator.
The Privacy Inflection Point
Third-party cookies are the invisible infrastructure of most digital marketing stacks. Their deprecation is not a future event — it is already underway. 70% of advertisers believe third-party cookie deprecation will negatively affect their digital advertising capabilities. (30)
Publishers could lose up to 60% of their total ad revenue following Chrome's full deprecation (136)
Ad impression CPMs fell 33% in early tests under Google's Privacy Sandbox (136)
60% of marketers are planning to implement identity resolution solutions as an alternative to third-party cookies (30)
First-party data strategies have become the number one investment priority for enterprise marketing teams (30)
The teams that are ahead of this have already rebuilt their audience infrastructure around first-party data — owned email lists, loyalty programs, CRM data, and on-site behavioral data. The teams that have not will pay a premium to reach the same audiences when the cookie era closes.
CRM: The Foundation Layer
The CRM is the connective tissue of the MarTech stack. 91% of companies with ten or more employees use a CRM system to manage customer data. (236) Near-universal adoption — but adoption and utilization are not the same thing.
78% of salespeople consider their CRM effective in enhancing sales and marketing alignment (81)
78% of sales leaders say CRM effectively improves alignment between sales and marketing teams (81)
45% of companies report that their use of CRM software has increased sales revenue (236)
Companies using shared CRM dashboards report 30%+ MQL-to-SQL conversion rates; shared lead scoring improves qualification accuracy by 22% (31)
SLAs tied to CRM workflows reduce lead handoff time by 48% (31)
The CRM stat that should concern most teams: 52% of marketers say their data strategy is owned by a team outside of marketing. (213) A CRM your team does not control is a CRM that does not serve marketing's priorities.
Data Management Is the Core Challenge
87% of marketers believe better data and analytics would improve their overall effectiveness. (213) Only 41% feel confident in their team's ability to analyze data effectively. (213) 37% cite lack of system integration as their primary data challenge; 23% struggle with manual data handoffs between tools. (213)
The data problem is not access — it is latency and ownership:
50% of marketers wait 1–3 business days to get data questions answered; 16% wait 4–5 days (213)
73% of marketers are not satisfied with the frequency or quality of data support they receive (213)
Only 32% of global marketers measure their media spending holistically across both digital and traditional channels (122)
Only 44% of marketers say they have access to high-quality data (213)
Only 33% say they can fully activate their data; just 24% have achieved personalization at scale (213)
36% say connecting data across channels and platforms is the most important area to improve in their analytics workflow (213)
Data blending queries grew 224% year-over-year from 2024 to 2025. (213) Marketers used 230% more data in 2024 compared to 2020. (213) The volume is not the problem. The infrastructure to act on it is.
Top measurement investment priorities for 2026: marketing mix modeling (40%), personalization at scale (38%), real-time campaign optimization (35%). (213)
The Measurement Gap
61% of marketers must prove ROI to justify marketing spend to leadership. (213) 40% say proving ROI across multiple channels is their single toughest measurement challenge. (213) Those two numbers describe the same team, at the same moment, every quarter.
The measurement landscape is shifting:
ROI is the top KPI for 45% of marketers in 2026 — down from 63% in 2024 (213)
62% currently conduct ROI analysis; 45% simultaneously cite it as their number one measurement challenge (213)
ROAS has emerged as a core KPI, cited by 34% of marketers overall; agencies are nearly twice as likely to prioritize it as brands (47% vs. 26%) (213)
Stakeholder alignment is the number one challenge in measuring digital marketing ROI, cited by 22% of global marketers (122)
Agencies are significantly more likely than brands to use marketing mix modeling (59% vs. 35%) and incrementality testing (40% vs. 23%) (213)
The agency/brand gap in advanced measurement is structural. Agencies measure this way because clients demand it. Most in-house teams have not yet built the capability — or the executive mandate — to require the same rigor.
Budget Pressures and Stack Consolidation
MarTech stacks grew during a decade of low-cost capital. They are being rationalized during a period of budget pressure. 55% of marketers are concerned about budget cuts in 2026. (213) 46% say personnel and headcount are at risk. (213) 15% specifically expect reductions in MarTech spending. (213)
55% cite "pressure to cut costs while maintaining results" as a key concern in 2026 (213)
44% struggle with balancing short-term sales goals against long-term brand strategy (213)
Content creation, calendaring, and collaboration tool adoption among B2B marketers declined by 8% compared to the previous year — a signal of deliberate stack consolidation (54)
36% of large enterprise marketers have fewer than 5 dedicated analytics team members (213)
49% of mid-market marketers say their analytics teams are understaffed (213)
The consolidation trend is predictable. Teams with 15+ tools and 3 analysts cannot derive compounding value from complexity. The next phase of MarTech adoption is fewer tools with deeper integration — not more tools with broader coverage.
Conclusion: What the Numbers Mean for Your 2026 Strategy
The statistics of digital marketing in 2026 are not just data points. They are a strategic blueprint. Pulled together, they point to seven priorities every B2B marketing leader should be acting on right now.
1. AI is now infrastructure, not a feature
95.4% of B2C marketers use AI in some form. (119) Yet only 6% have fully embedded it. (213) That gap is the entire opportunity. Companies that move from "experimenting with AI" to "AI-native workflows" in the next 12 months will have a 60% lower CAC (18) and 50% more sales-ready leads (18) than competitors stuck in pilot mode. The question is no longer whether to adopt — it is how fast you can build internal AI literacy. 92% of marketing leaders say AI fluency will be mandatory within 2–4 years. (68)
2. The fundamentals are still where ROI lives
Email still delivers $36 per $1 spent — the highest ROI of any channel. (71) SEO still drives 57.8% of all web traffic. (10) Content marketing still generates 3x more leads at 62% less cost than outbound. (40) The flashy channels matter, but they sit on top of fundamentals that have not changed. The companies winning in 2026 are not chasing the new — they are executing the proven with discipline.
3. Privacy is forcing a structural rebuild — start now
Third-party cookies are already largely gone for most users. Publishers could lose up to 60% of ad revenue. (136) 70% of advertisers say cookie deprecation will negatively affect their capabilities. (30) The brands ahead of this have already pivoted to first-party data — owned email lists, loyalty programs, on-site behavioral data. The brands that have not will pay a premium to reach the same audiences in 18 months.
4. Mobile is the surface, not a channel
51.6% of global web traffic is mobile. (35) 96.2% of internet users access the web via mobile. (56) Mobile apps convert 157% better than mobile websites. (220) Yet over 50% of landing pages are still not optimized for mobile. (177) Every other channel — search, email, social, video — is consumed primarily on a 6-inch screen. Mobile-first is no longer a best practice. It is the only practice.
5. Video is the dominant content format — short-form for ROI, long-form for SEO
91% of businesses use video as a marketing tool. (14) Short-form video has the highest ROI of any format (81), but long-form wins on search rankings (first-page YouTube results average 14:50). The mistake is treating them as competing formats. They serve different funnel stages and need separate strategies.
6. Lead generation is broken at the qualification layer, not the top of funnel
79–80% of leads never convert. (47) 44% of sales reps never follow up. (47) The average MQL-to-SQL conversion rate is 13% (31) — top performers reach 40%. The bottleneck is not demand generation; it is what happens after a lead arrives. Fix nurturing, scoring, and follow-up speed and you can double conversion without spending more on traffic.
7. Omnichannel is the new baseline, not a competitive edge
Omnichannel shoppers deliver 30% higher lifetime ROI (26) and shop 70% more frequently. (26) Brands with strong omnichannel engagement achieve 89% customer retention vs. 33% for single-channel. (26) Single-channel marketing is structurally underperforming. The companies pulling ahead are not adding more channels — they are connecting the channels they already use.
What the gap between average and top performers actually is
Top 25% of landing pages convert at 5.31% or higher. The cross-industry median is 2.35%. (94) That is more than 2x — and the gap is not budget. Top performers spend the same. They make better decisions:
They run systematic CRO programs, not occasional A/B tests (only 39.6% of companies have a documented CRO strategy (177))
They invest in first-party data infrastructure before they need it
They build integrated tech stacks instead of buying more tools (44% of US teams use 4+ tools simultaneously, but tool count is not the variable — connectivity is (135))
They treat mobile UX, page speed, and accessibility as revenue levers, not technical concerns
They prove ROI with rigor — agencies use marketing mix modeling 59% vs. 35% for in-house teams (213)
The 2026 mandate
Digital marketing in 2026 rewards integration, discipline, and data literacy more than budget. Three actions for the next 90 days:
Audit your data infrastructure. 87% of marketers say better data would improve effectiveness (213) — only 41% feel confident in their ability to analyze it. (213) The gap is fixable.
Pick one AI workflow to fully operationalize. Not five experiments. One workflow, embedded in production, with measurable outputs.
Identify the channel where your conversion is leaking the most — and fix that before scaling traffic. Sending more traffic to a leaking funnel just fills a leaking bucket faster.
The gap between average marketing teams and exceptional ones is not budget. It is decision quality. Use the data in this guide to make better decisions faster.
Grow Your Pipeline Without Growing Your Team
The online marketing statistics in this guide represent what is possible. Turning possibility into pipeline is where Foursets comes in.
We build and manage digital marketing systems for B2B companies that need real, measurable results. No guesswork. No recycled playbooks. Strategy built on the same kind of data you just spent 6,000 words reading.
If you are a CMO or VP of Marketing at a 50 to 200 person company and you are tired of channel experiments that never compound into reliable pipeline, let us show you what a data-driven program looks like in practice.
Book a free strategy call with Foursets. No pitch deck. Just a conversation about your numbers and what they could look like 12 months from now.
FAQ: Digital Marketing Facts and Common Questions
How big is the digital marketing industry in 2026?
The global digital marketing industry was valued at $456.7 billion in 2025 by IMARC Group and is projected to reach $1.2 trillion by 2034 at a 10.99% CAGR. (82) Expert Market Research puts the figure higher at $653.65 billion in 2025, growing to $1.58 trillion by 2035 at 9.20% CAGR. (64) The range reflects different scope definitions — some count only ad spend, others include software and services. U.S. digital ad revenue alone hit a record $294.6 billion in 2025. (150)
What percent of advertising is digital?
Digital advertising commands 73% of total global media spend in 2026, with global digital ad spend reaching $740 billion — up 11.4% year-over-year. (48) In the U.S., digital ad spending exceeded $383 billion projected by 2027. (197) The shift is essentially complete: traditional advertising now operates as a supporting channel to digital, not the other way around.
Is digital marketing the fastest growing industry?
Digital marketing is one of the fastest-growing channels in marketing. Mobile is the fastest-growing digital channel by revenue (64), and within digital ad formats, digital video grew 25.4% YoY to $78 billion (150) while social media advertising grew 32.6% to $117.7 billion in 2025. (150) The marketing automation market alone is projected to grow from $8.23 billion in 2024 to $21.7 billion by 2032. (216)
What is the ROI of digital marketing in 2026?
ROI varies sharply by channel. Email leads at $36 per $1 spent (71) — the highest ROI of any digital channel. PPC averages $2 per $1 with effective optimization. (230) Content marketing generates 3x more leads at 62% less cost than outbound. (40) SEO leads close at 14.6% vs 1.7% for outbound (52), and 49% of marketing professionals say organic search delivers the best ROI of any channel. (145) Every $1 invested in UX design yields $100 in return — a 9,900% ROI. (223)
Will AI replace digital marketers?
No — but marketers who do not use AI will be replaced by those who do. 95.4% of B2C marketers now use AI in some form, up from 77.2% one year prior. (119) Yet only 6% have fully embedded AI into their workflows. (213) 92% of marketing leaders believe AI literacy will be mandatory within 2–4 years (68), and 85% of creative leaders already reclaim 4+ hours per week using AI tools. (68) AI is augmentation, not replacement — the gap between AI-native marketers and AI-laggards is widening fast.
Is SEO dead or evolving in 2026?
SEO is evolving — not dying. Organic search still accounts for 57.8% of all web traffic worldwide (10), and Google still processes 16.4 billion searches per day. (10) What has changed is the click equation. AI Overviews now appear on ~31% of Google SERPs (70), and when they appear, organic CTR drops 61% (from 1.76% to 0.61%). (39) U.S. organic search traffic declined 2.5% YoY in 2025 (217) — but 92.36% of AI Overview citations come from domains already ranking in the top 10. (39) Ranking still matters; the strategy around it has shifted.
What is the success rate of digital marketing?
It depends on how you measure it. Average website conversion rate across all industries is approximately 2.9% (177) — but the top 25% of pages convert at 5.31% or higher. (94) B2C conversion averages 2.1%, B2B 1.8%, B2B SaaS just 1.1%. (177) On the lead side, 79–80% of leads never convert into a sale (47), mostly due to poor nurturing and follow-up speed. The success rate gap between average and top performers is more than 2x — and it is driven by execution discipline, not budget.
What are the most effective digital marketing channels for B2B?
For lead quality: 57% of B2B marketers say SEO generates more leads than any other initiative (92), 73% say webinars produce the best quality leads (18), and LinkedIn drives ~80% of all B2B social media leads. (18) For ROI: email delivers $36 per $1, and organic search has the highest B2B channel conversion rate at 2.6%. (177) For paid ROAS: LinkedIn Ads deliver 113% ROAS for B2B, vs Google Ads at 78% and Facebook at 29%. (168)
How important is mobile marketing in 2026?
Mobile is no longer a channel — it is the primary surface for almost all digital marketing. 96.2% of users access the web via mobile (56), 51.6% of global web traffic is mobile (35), and smartphones generate 71% of online shopping orders. (204) Mobile apps have 157% higher conversion rates than mobile websites. (220) Yet over 50% of landing pages are still not optimized for mobile (177) — making mobile-first one of the highest-leverage gaps to fix in most marketing programs.
What is the future of digital marketing?
Three structural shifts will define the next 24 months:
AI moves from tactic to infrastructure — only 6% of marketers have fully embedded AI today (213), but 92% believe AI literacy will be mandatory soon. (68)
Privacy forces a rebuild of targeting — as third-party cookie restrictions tighten, first-party data strategies have moved to the top of enterprise marketing investment priorities. (30)
Omnichannel becomes the baseline — brands with strong omnichannel engagement achieve 89% retention vs. 33% for single-channel (26), and the gap is structural, not seasonal.
The marketers winning in 2027 are the ones acting on all three now.
Trakya University Journal of Social Sciences. "THE IMPORTANCE OF DIGITAL MARKETING AND TECHNOLOGIES IN B2B MARKETING - Trakya University Journal of Social Science." https://tujss.org/articles/doi/trakyasobed.1460110

.avif)