Google still runs the web. But how people search, and what they get back, changed more in two years than in the previous ten. AI Overviews sit on top of results, clicks leak out of the SERP, and a generation now asks ChatGPT first. Google is still winning, just a different game.
When someone says "SEO," they mean Google. But the rules changed: ranking #1 no longer guarantees the click it once did.
In this article, you will learn how many searches Google handles per year, day, and second; its market share worldwide; how far AI Overviews have spread; what people search for most, how ChatGPT is changing that; and where Google CTR and zero-click searches stand in 2026.
These Google search statistics are pulled from primary research by Google, Statista, StatCounter, DataReportal, Ahrefs, Semrush, BrightEdge, Search Engine Journal, and others. This data provides marketers, business leaders, and in-house SEO teams with the insights needed to navigate evolving search trends, adapt their strategies, and make data-driven decisions in a rapidly changing search environment.
Top Google Search Statistics
As of May 2026, Google commands 90.46% of the global search engine market across all devices (1), and Google.com ranks as the world's most-visited website, drawing 87.5 billion total visits that month (2).
In the United States, Google's all-device search share stood at 85.51% as of May 2026 (3).
In its first official count since 2016, Google reported handling more than 5 trillion searches a year as of 2025, which breaks down to about 14 billion a day, 9.5 million a minute, and roughly 158,548 every second (4).
Around 3.9 billion people turn to Google Search daily, each running roughly 3 to 4 queries (5).
Within search, Google's share varies by device: as of May 2026 it holds 95.52% of all mobile search, 85.58% of tablet search, and 84.49% of desktop search, its lowest, since desktop is where rivals like Bing are strongest (6, 7, 8).
Google drives 345 times more traffic to websites, while AI tools still account for only about 0.1% of all web referrals as of May 2025 (9).
Zero-click results keep climbing: 68.01% of US Google searches ended without a click in 2026, versus about 60% in 2024 and roughly 49% in 2019 (10).
After more than 25 years of crawling and tiering, Google's search index held roughly 400 billion documents as of 2020, drawn from trillions of pages crawled (11).
The March 2026 core update proved especially turbulent: 79.5% of top-3 URLs changed position (up from 66.8%), 90.7% shifted across the top 10, and 24.1% of top-10 pages fell out of the top 100 (12, 13).
Google's Search Engine Market Share Statistics
Google holds 90.46% of the worldwide search engine market across all devices as of May 2026 (1).
Search Engine
Global Share, All Devices (May 2026)
Google
90.46%
Bing
5.03%
Yahoo!
1.40%
Yandex
0.99%
DuckDuckGo
0.71%
Baidu
0.53%
Table 1: Worldwide search engine market share, all devices, May 2026. Source: StatCounter. (1)
Statista put Google at 90.02% across all devices in April 2026 (14).
Google.com is the most-visited website in the world, with 87.5 billion total visits in May 2026, according to Similarweb (2).
#
Domain
Monthly Visits
MoM Traffic Change
Yearly Change
1
google.com
87.5B
3.25%
5.12%
2
youtube.com
29.9B
5.24%
2.51%
3
facebook.com
11.8B
2.87%
3.74%
4
instagram.com
7.4B
5.20%
15.46%
5
chatgpt.com
5.6B
0.99%
24.02%
6
reddit.com
4.4B
4.25%
21.32%
7
x.com
4.2B
3.28%
1.53%
8
whatsapp.com
3.6B
1.66%
−5.58%
9
tiktok.com
3.6B
2.52%
25.08%
10
bing.com
3.5B
2.26%
−2.93%
Table 2: The world's 10 most-visited websites by monthly visits, May 2026. Source: Similarweb. (2)
Google's worldwide search market share has stayed in a narrow band for over a decade, never dropping below 89%. It was at 89.63% in January 2015, peaked at 93.37% in February 2023, fell to a low of 89.35% in October 2024, and stood at 90.46% in May 2026 (1).
Google's share of search differs by device: as of May 2026 it holds 95.52% of all mobile search, 85.58% of tablet search, and 84.49% of desktop search (6, 7, 8).
Search Engine
Desktop
Mobile
Tablet
Google
84.49%
95.52%
85.58%
Bing
9.93%
0.70%
10.82%
Yahoo!
2.48%
0.51%
0.67%
Yandex
1.04%
0.94%
0.76%
DuckDuckGo
0.72%
0.69%
0.97%
Baidu
0.39%
0.64%
0.56%
Table 4: Worldwide search engine market share by platform, May 2026. Source: StatCounter. (6, 7, 8)
Chrome holds 70.25% of the global browser market and ships with Google as the default (15).
Despite the rise of AI chatbots, the spread of AI Overviews, Google remains the undisputed leader of search. No rival has taken meaningful share in over a decade.
"Unsurprisingly, there's very little to report in the traditional search engine market. Google dominates. No one is taking share from them in meaningful ways. If you want to appear in traditional web search (and you should, because 99% of people still use it to find what they're seeking on the web), Google remains an undisputed monopoly."
— Rand Fishkin, SparkToro Co-founder & CEO, in Datos' State of Search Q2 2025 report (16)
Google Search Statistics by Region
Google leads search in nearly every country, but the global 90% hides huge regional gaps (1).
Region
Google Share (May 2026)
Africa
95.66%
Asia
92.86%
South America
90.17%
Europe
88.33%
Oceania
88.06%
North America
85.69%
Table 5: Google search engine market share by continent, all devices, May 2026. Source: StatCounter. (1)
Google's share is highest in Africa (95.66%) and Asia (92.86%), and lowest in North America (85.69%), where Bing has more presence. Asia stays near 93% even though China is Google's weakest market, because India, Indonesia, and Southeast Asia outweigh it (1).
As of May 2026, the ten markets with the highest Google share are Iran (99.63%), Iraq (99.59%), Thailand (99.52%), Nigeria (98.73%), Israel (98.35%), India (97.64%), Uganda (97.19%), Nepal (97.17%), Ghana (97.12%), and Jordan (97.02%) (1).
Among the largest, most competitive Western markets, Google's share is lower: Germany (80.53%), the United States (85.51%), Italy (85.85%), and France (88.69%) (1).
#
Country
Google Share (May 2026)
1
Iran
99.63%
2
Iraq
99.59%
3
Thailand
99.52%
4
Nigeria
98.73%
5
Israel
98.35%
6
India
97.64%
7
Uganda
97.19%
8
Nepal
97.17%
9
Ghana
97.12%
10
Jordan
97.02%
11
Pakistan
96.92%
12
Bangladesh
96.89%
13
Kenya
96.85%
14
Egypt
96.68%
15
Serbia
96.40%
16
Algeria
96.29%
17
Bulgaria
96.02%
18
Romania
95.87%
19
Tanzania
95.84%
20
United Arab Emirates
95.44%
21
Saudi Arabia
95.38%
22
Qatar
95.25%
23
Hungary
94.98%
24
Kuwait
94.91%
25
Croatia
94.84%
26
Guatemala
94.65%
27
Greece
94.62%
28
Argentina
94.21%
29
Colombia
94.12%
30
Uruguay
94.00%
31
Morocco
93.97%
32
Ireland
93.79%
33
Ethiopia
93.73%
34
Indonesia
93.72%
35
Sri Lanka
93.26%
36
Singapore
93.18%
37
Ecuador
93.16%
38
Azerbaijan
93.06%
39
Malaysia
93.03%
40
Venezuela
92.08%
41
Spain
91.84%
42
South Africa
91.58%
43
Peru
91.55%
44
Ukraine
91.38%
45
United Kingdom
91.17%
46
Hong Kong
91.11%
47
Tunisia
90.85%
48
Norway
90.75%
49
Philippines
90.72%
50
Chile
90.31%
Table 6: Top 50 markets by Google search share, all devices, May 2026. Source: StatCounter. (1)
Google generates 70% to 80% of desktop search traffic in most major markets, and over 90% in India (17).
According to SQ Magazine, the United States leads the world by far in websites indexed by Google, with 13,451,738, followed by the United Kingdom (1,402,671), Brazil (881,093), Japan (811,601), and Germany (753,093). The full breakdown is below (18).
Country
Websites Indexed by Google
United States
13,451,738
United Kingdom
1,402,671
Brazil
881,093
Japan
811,601
Germany
753,093
Netherlands
715,006
France
676,197
Italy
614,044
Russia
608,713
Table 7: Leading countries by number of websites indexed by Google. Source: SQ Magazine. (18)
United States
The United States is the world's biggest, most-used, and most-visited online search market, and the center of the global AI search race (19).
Google holds 85.51% of US search across all devices as of May 2026 (3).
Search Engine
US Share, All Devices (May 2026)
Google
85.51%
Bing
9.65%
Yahoo!
2.62%
DuckDuckGo
1.67%
Yandex
0.35%
Ecosia
0.11%
Table 8: US search engine market share, all devices, May 2026. Source: StatCounter. (3)
By platform (May 2026): Google holds 92.37% of US mobile search and 82.13% of US desktop search (20, 21).
Google held 60.4% of US searches in February 2025 and processed over 14.7 billion queries that month (22, 23).
The United States accounts for 21.1% of all global traffic to Google.com, close to Bing, which draws almost 22% of its worldwide traffic from the US (24, 25).
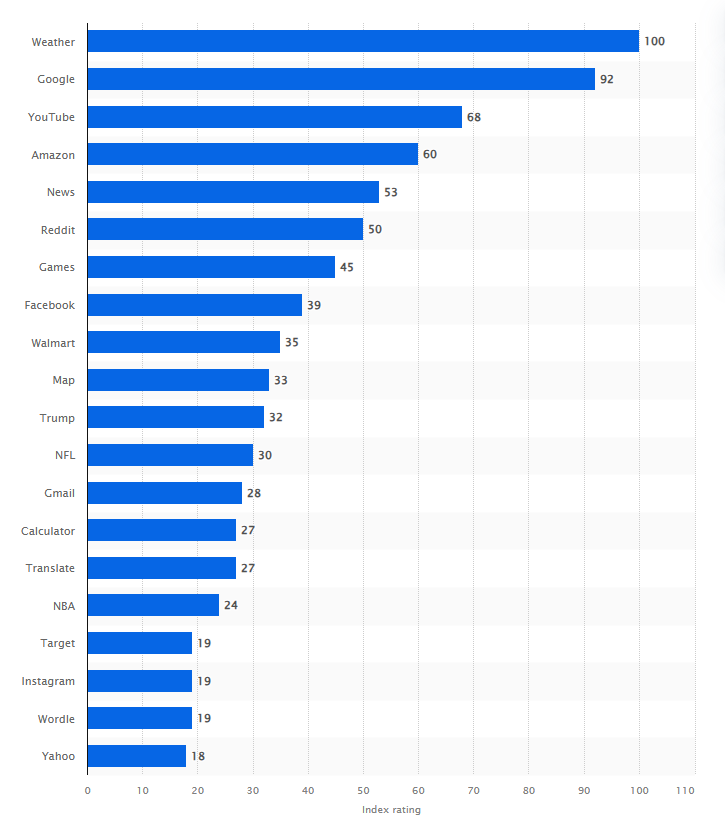
The most-searched Google queries in the US (July 2024–June 2025) were "Weather," "Google," "YouTube," "Amazon," "News," "Reddit," "Games," "Facebook," "Walmart," and "Map," according to Statista (26).
Figure 1. Top Google search queries in the United States in 2025, by index rating. Source: Statista. (26)
By monthly search volume (January–March 2025), the top US keywords were "Weather" (116.63M), "nba" (58.71M), and "nfl" (46.88M) (27).
Europe
Across Europe, Google holds 88.33% of search as of May 2026 (28).
Highest Google share in Europe: Serbia 96.40%, Bulgaria 96.02%, Romania 95.87%, Hungary 94.98%, Croatia 94.84%, Greece 94.62%, and Ireland 93.79% (1).
Among Europe's largest economies, Google's share ranges from 91.84% in Spain and 91.17% in the UK down to 88.69% in France, 85.85% in Italy, and 80.53% in Germany, its lowest in any major European market (1).
Russia is the only European market Google does not lead: Yandex holds 70.57% to Google's 27.15%. In Belarus, Google leads at 63.12%, but Yandex is strong at 34.5% (1, 29).
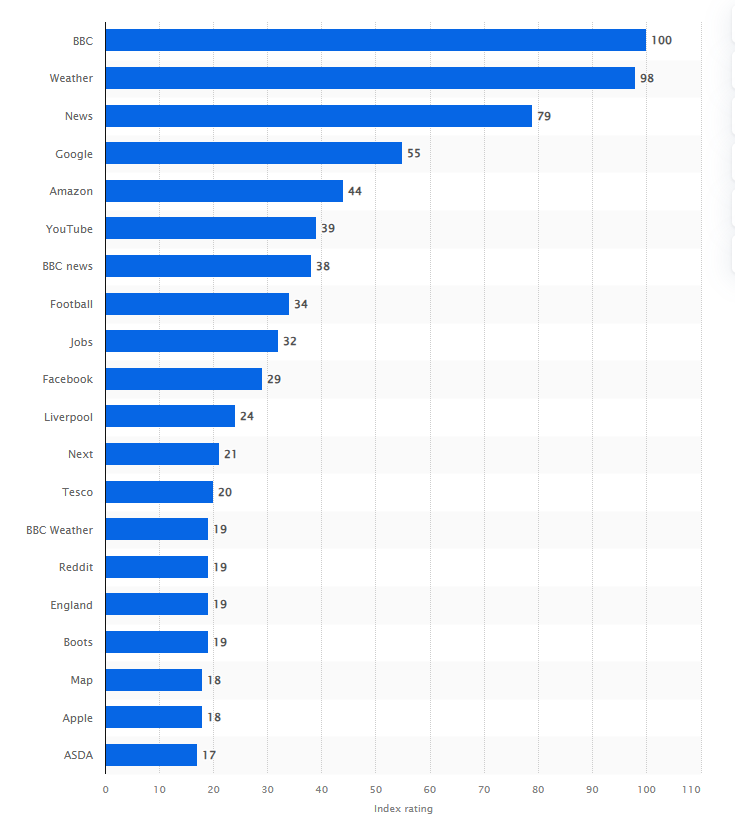
United Kingdom queries: "BBC" was the most-entered Google query (July 2024–June 2025); by volume, "Weather" drew 23.66M monthly searches and "Premier League" 13M (30, 31).
Figure 2. Top Google search queries in the United Kingdom in 2025, by index rating. Source: Statista. (30)
Germany queries: the top Google terms in February 2025 were event-driven, led by "handball wm" and "australian open 2025" (32).
Asia
Across Asia, Google holds 92.86% of search as of May 2026, even though China is its single weakest market worldwide (1).
Highest Google share in Asia: Thailand 99.52%, India 97.64%, Nepal 97.17%, Pakistan 96.92%, Bangladesh 96.89%, Indonesia 93.72%, Sri Lanka 93.26%, Singapore 93.18%, and Malaysia 93.03% (1).
China is Google's weakest market: Google holds just 1.76%, while Baidu leads at 47.16% by StatCounter and commands 53%+ of the domestic market by other counts; its ERNIE Bot has 200M monthly users, and Bing draws 25%+ of its worldwide traffic from China (33, 34, 25).
In South Korea, Google holds 47.87%, with Naver close behind at 41.67% (35).
In Japan, Google holds 58.10%, with Bing unusually strong at 33.36% (36).
In Kazakhstan, Google holds 69.05%, with Yandex at 28.65% (1).
In Taiwan, Google holds 81.52% (1).
India is Google's single largest market: 1.5 billion searches per day, 840+ million monthly users, and over 99% mobile search share. Its most-searched queries (July 2024–June 2025) were "video" and "WhatsApp" (5, 37, 38).
Other global regions
Latin America: across South America, Google holds 90.17%, strongest in Argentina (94.21%), Colombia (94.12%), Uruguay (94.00%), Ecuador (93.16%), Peru (91.55%), and Chile (90.31%); Brazil sits at 86.42%, and Mexico (counted in North America) at 87.04%. Mexico's top queries are weather-related (Clima, Tiempo) plus WhatsApp and YouTube (1, 39).
Africa: one of Google's strongest regions at 95.66%, led by Nigeria (98.73%), Uganda (97.19%), Ghana (97.12%), Kenya (96.85%), Tanzania (95.84%), Ethiopia (93.73%), and South Africa (91.58%) (1).
Middle East: near-total Google dominance, with Iran (99.63%), Iraq (99.59%), Israel (98.35%), Jordan (97.02%), Egypt (96.68%), UAE (95.44%), Saudi Arabia (95.38%), Qatar (95.25%), and Kuwait (94.91%). The exception is Turkey at 82.59%, where Yandex holds 14.91% (1).
Oceania: Google holds 88.06%; its largest market, Australia, sits at 87.97%, with Bing stronger here (8.97%) than in most regions (1).
Google Usage Statistics
How often people use Google
Google processes more than 5 trillion searches per year as of 2025 (Google's first official count since 2016), which works out to roughly 158,548 searches per second, 9.5 million per minute, and 14 billion per day (4).
Roughly 3.9 billion people use Google Search every day, running about 3 to 4 searches each (5).
80.6% of online adults worldwide use search engines every month (40).
Google reports that over 15% of its daily search queries are completely new, never searched before (18).
Peak search times fall between 8 AM and 10 AM and between 6 PM and 9 PM (18).
On Google.com, the average visit lasts 10 minutes 3 seconds and spans 8.65 pages, with a bounce rate of 28.29% (41).
Global search engine use has dipped 3.5 percentage points since early 2021, even as the total user base kept growing (40).
Who uses Google, by gender and age
Google.com's audience skews 57.22% male and 42.78% female (41).
Google website traffic by age group:
Age Group
Share of Google Traffic
25–34
26.85%
18–24
21.12%
35–44
19.13%
45–54
14.65%
55–64
10.85%
65+
7.41%
Table 9: Google website traffic by age group, 2026. Source: SQ Magazine (citing ElectroIQ). (41)
Gen Z is Google's fastest-growing search demographic; 1 in 10 of their searches now starts with Google Lens, and 1 in 5 of those carries commercial intent (42).
Gen Z are especially heavy Google users: signed-in 18-to-24-year-olds issue more searches per day than any other age group, and 80% of Gen Z use Google for shopping, from discovering and browsing to researching and buying (43).
Search across Google's products and surfaces
US Google search activity by product (2025):
Google Product
US Search Activity Share (2025)
Google Homepage
86.94%
Google Images
10.62%
Google Video
1.16%
Google Maps
0.64%
Google News
0.38%
Google Shopping
0.23%
Table 10: US Google search activity by product, 2025. Source: SQ Magazine. (5)
Google Lens processes over 20 billion visual searches per month (5).
Google Images receives over 1.1 billion daily queries, and more than 35% of users run an image search at least once a week (5).
The shares above reflect traffic to Google's dedicated verticals; product- and news-intent searches on the main index run far higher. Google News draws over 150 million daily visits, and Google Shopping sees over 900 million daily product queries (18).
Google handles over 1 billion health-related searches every day (18).
Google Discover delivers over 5 billion daily impressions (18).
Google's impact on discovery, shopping, and research
In a HubSpot survey of 336 US web professionals (September 2024), 26% ranked Google Search as their single biggest traffic driver, more than any other channel; paid social and paid search tied for second at 10% (44).
80% of online product journeys begin with a Google search, and Google handles over 1.4 billion product-related queries every day (18).
Search engines are a leading brand-discovery channel: 32.9% of internet users aged 16+ find new brands, products, and services through search (45).
53% of US consumers research online with a search engine before deciding to buy (46).
87% of customers use Google to find local businesses, and 97 billion local searches take place every month (47, 48).
Over 70% of students use Google for assignments, and Google Scholar receives over 160 million visits per month (18).
Privacy and user behavior
72% of US users are concerned about Google tracking, yet only 14% regularly use incognito mode; "delete Google history" searches rose 47% year over year, and 18% of users have tried DuckDuckGo alternatives (18).
Desktop and Mobile Google Search Statistics
The device split
Across the web as a whole, and for all search engines, mobile has overtaken desktop for internet access worldwide as of May 2026: 50.29% of all web traffic comes from mobile devices, 48.24% from desktop, and 1.48% from tablet (49).
Google's search share is highest on mobile (95.52%) and lowest on desktop (84.49%) as of May 2026, with tablet at 85.58% (see the platform breakdown in the market share section) (6, 7, 8).
Google is the built-in default on most phones: Android held over 72% of the global smartphone OS market in 2024 (50).
Mobile search
71% of Google searches are conducted on mobile devices (18).
As of April 2026, Google accounted for 95.52% of the global mobile search engine market worldwide, and its search engine has dominated the market since its 1997 launch (52).
In the US, Google holds 92.37% of mobile search as of May 2026 (20).
In the UK, Google's mobile share reached 97.55% in January 2025 (53).
47% of keywords ranking in positions 1–20 rank differently on mobile than on desktop (54).
88% of users who search for a local business on a mobile device call or visit within 24 hours (55).
Google uses the mobile version of a site's content, crawled with the smartphone agent, for both indexing and ranking, known as mobile-first indexing (56).
Mobile-friendliness is a Google ranking signal, so Google favors mobile-optimized sites (57).
Desktop search
StatCounter puts Google's global desktop share at 84.49% (May 2026), while Statista, which measures desktop differently, recorded a low of 78.8% in January 2025, Google's lowest in over 15 years (8, 58).
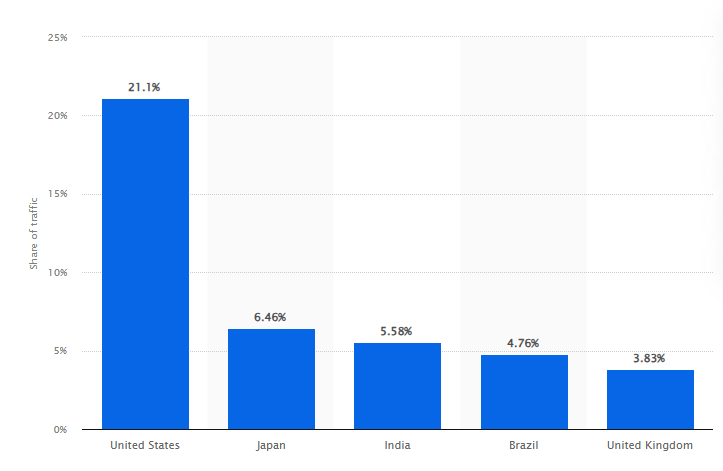
By country, the US generates the largest share of Google.com's desktop traffic at 21.1% (May 2025), ahead of Japan (6.46%), India (5.58%), Brazil (4.76%), and the UK (3.83%) (24).
Figure 3. Regional distribution of desktop traffic to Google.com in May 2025, by country. Source: Statista. (24)
Desktop is where Google's rivals gain the most ground, though Google still dominates: Bing takes 9.93% of global desktop search, nearly double its all-devices share, but remains a distant second (8).
58% of B2B search queries still come from desktop (5).
Google sends 345 times more traffic to websites than ChatGPT, Gemini, and Perplexity combined, and AI tools account for about 0.1% of all web referral traffic (9).
Measured across all engines and tools, traditional search still drives about 30 times more traffic than AI search tools (59).
Google.com remained the most-visited destination even from inside AI tools in both Q2 2024 and Q2 2025, while ChatGPT.com sat at #9 among US search destinations (16).
According to Ahrefs, average web search traffic fell 21% year over year through 2025, while AI-driven traffic grew 9.7x in the same period (9).
In the US, AI tools' share of search-related activity nearly tripled, from 0.24% in April 2024 to 0.64% in April 2025 (16).
According to HubSpot's 2026 State of Marketing report, nearly 30% of marketers report decreased search traffic as users turn to AI tools (60).
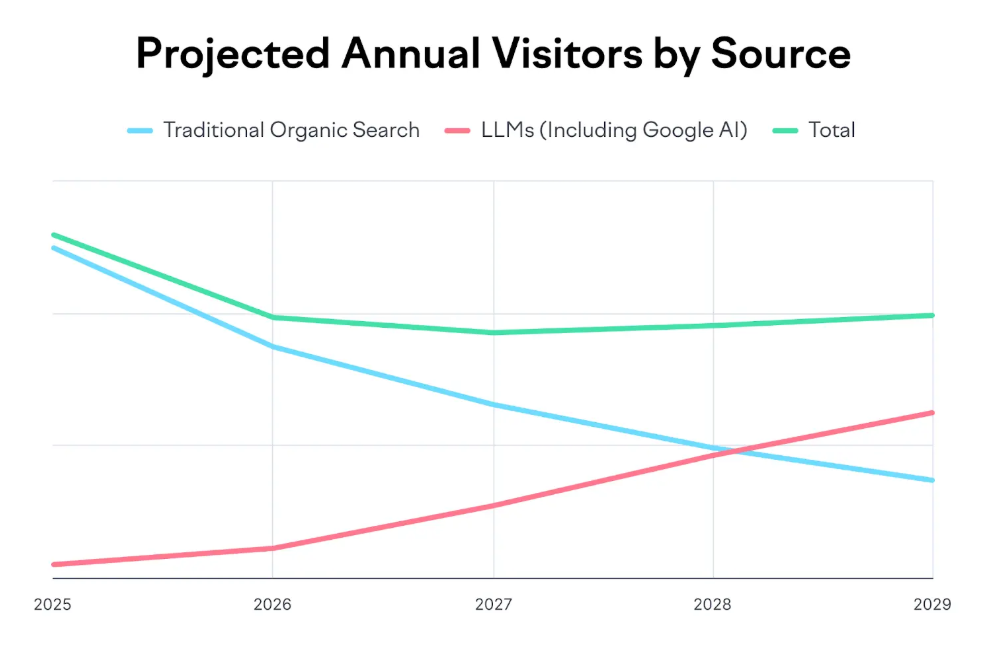
AI search visitors are projected to overtake traditional search visitors by early 2028 for SEO and marketing topics, according to Semrush's 2025 study of AI search's impact on SEO traffic (61).
Figure 4. Projected annual visitors by source: traditional organic search vs. LLMs, 2025–2029. Source: Semrush. (61)
"AI tool adoption has almost tripled in a year in the EU/UK and more than doubled in the US. While they're still a tiny fraction of traditional search's size (remember, only ~1 in 8 prompts has search-like intent; most of AI use is for generative tasks), in 6 to 10 years it could rival traditional search engines in raw usage."
— Rand Fishkin, SparkToro Co-founder & CEO, in Datos' State of Search Q2 2025 report (16)
AI chatbots and tools
Worldwide AI chatbot market share (StatCounter, May 2026):
AI Chatbot
Market Share (May 2026)
ChatGPT
79.08%
Perplexity
7.67%
Google Gemini
7.03%
Microsoft Copilot
3.23%
Claude
2.98%
DeepSeek
0.01%
Table 11: Worldwide AI chatbot referral/usage share, May 2026. Source: StatCounter. (62)
ChatGPT is the most popular AI app worldwide, with roughly 957.8 million monthly active users as of April 2026, ahead of Doubao (336M) and Qwen (220M) (63).
ChatGPT grew from about 358 million monthly users in January 2025 to around 810 million by November 2025, and is the most downloaded GenAI app (64).
ChatGPT's weekly active users climbed to 800 million by October 2025 and 900 million by late February 2026 (65).
Among people who use AI tools, ChatGPT anchors about 31% of users in the US and 41% in Europe, a share-of-users measure that runs lower than its referral-share lead in Table 10 (16).
Google's AI Mode crossed 1 billion monthly users within a year of its 2025 launch (Google I/O 2026), with query volumes more than doubling every quarter, although independent clickstream data showed AI Mode on just 0.34% of all searches in early 2026 (10).
In February 2026, ChatGPT's app saw over 7 million US downloads versus Gemini's 4.8 million (66).
Perplexity and Gemini are each roughly one-tenth of ChatGPT's size, and Copilot, Claude, and the rest trail further behind (67).
DeepSeek spiked to roughly 6–7% of AI tool use after its January 2025 launch, fell to about 3% by June 2025, and faded to near zero on StatCounter's chatbot tracker by 2026 (16).
OpenAI launched ChatGPT Atlas, a browser with ChatGPT built in, in October 2025 (42).
AI search value and adoption
The average AI search visitor is worth 4.4 times more than a traditional organic search visitor (61).
AI search visitors convert 23 times better than traditional organic visitors; in one study, AI drove 12% of signups from just 0.5% of traffic (9).
15 million US adults used generative AI as their primary search method in 2024, projected to exceed 36 million by 2028 (68).
A 2024 Search Engine Journal survey projected that 79% of consumers would use AI-enhanced search within a year, with 70% already trusting results from tools like ChatGPT and Perplexity (69).
Over 20% of Americans now use AI tools 10 or more times per month (10).
In the UK, 31% of adults had used AI models like ChatGPT and 48% had not, though over 80% were aware of them (70).
95% of B2B buyers plan to use generative AI in at least one area of a future purchase (71).
Two-thirds of sales professionals predict that by 2030 most people will use chatbots like ChatGPT instead of search engines (72).
"My company got a lead from ChatGPT a few months ago, and we could see that they visited our site seven times from ChatGPT in the process before eventually filling out our form. This is not user behavior that we would have planned for or anticipated just a few years ago."
— Corey Morris, President and CEO of Voltage, in Search Engine Journal's "The B2B SEO Trap" (73)
Who AI tools cite
80% of AI-cited sources don't appear in Google's traditional search results at all, and only 12% match Google's top results; Wikipedia dominates AI citations (9).
28.3% of ChatGPT's most-cited pages have zero Google organic visibility (74).
ChatGPT Search cites pages ranking in positions 21 or lower about 90% of the time (61).
67.7% of ChatGPT's top citations come from sources marketers can't influence, such as Wikipedia, homepages, and app stores; only 32.3% are influenceable content (74).
"Best X" listicles are the single most-cited content format by ChatGPT, making up 43.8% of its cited page types (74).
AI Overviews now reach 2.5 billion monthly users as of Google's I/O 2026 keynote, up from about 1.5 billion in Q1 2025 reported by Ahrefs (9, 75).
By BrightEdge's keyword tracking, AI Overviews appeared on 48% of queries in early 2026, with 52% showing none (76).
Ahrefs puts AI Overviews on 16% of US Google searches (9).
SparkToro reports AI Overviews now appear on 20%+ of all searches (10).
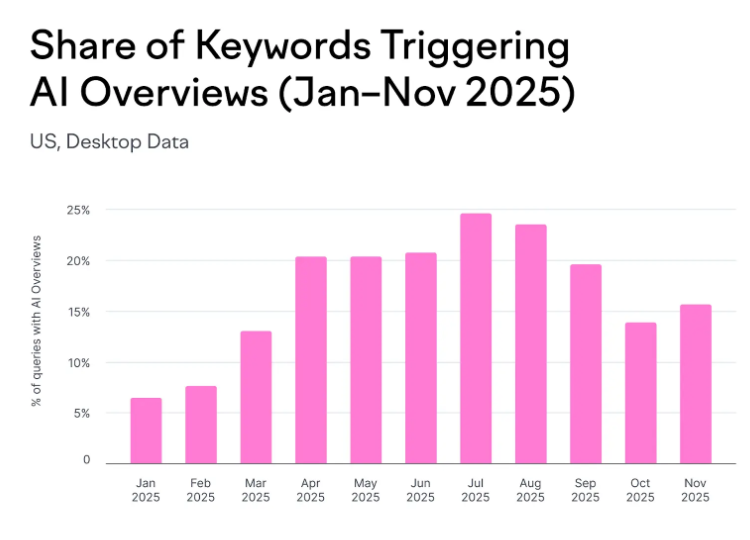
Semrush's study of 10M+ keywords found AI Overview triggers grew rapidly early in 2025 before settling at around 16% of all queries: 6.49% in January, peaking at 24.61% in July, and 15.69% by November (US, desktop) (90).
Figure 5. Share of keywords triggering AI Overviews, January–November 2025 (US, desktop data). Source: Semrush. (90)
AI Overview presence grew 58% year over year from February 2025 to February 2026 (76).
Longer, complex queries triggering AI Overviews grew 49% since May 2024, and AIOs now appear in 25% of searches using 8 or more words (67, 77).
AIOs appeared on 17.1% of queries across 300 B2B SaaS sites in 2025 (78).
Google first tested the feature as SGE in May 2023, expanded it to 120+ countries by November 2023, and relaunched it as AI Overviews in May 2024 (69).
What an AI Overview looks like
The average AI Overview runs 119 words on desktop and 91 on mobile; the longest recorded was 417 words (79).
AI Overviews carry an average of 11 links each (79).
Average AIO pixel height grew about 15% year over year to 1,200+ pixels, pushing organic results entirely below the fold on a standard screen (76).
AI Overviews change every 2.15 days on average, with 70% of content differing between observations, though semantic similarity stays at 0.95 (74).
About 9% of AI Overviews appear outside position one in the SERP (80).
What triggers an AI Overview
Most searches that trigger an AI Overview come from people looking to learn something rather than to buy: Semrush found about 88% are informational, 8.69% commercial, 1.76% transactional, and 1.43% navigational (81).
AI Overviews appear on 57.9% of question queries versus 15.5% of non-question SERPs, making question-based content about 3.7x more likely to trigger one (82).
82% of desktop and 76% of mobile AI Overviews appear for keywords with fewer than 1,000 monthly searches (79).
Exact-match keywords appear in only 5.4% of AI Overviews (83).
Coverage growth varies by industry: entertainment AIOs grew 175%, travel 108%, but B2B technology only 7% (83).
Impact on clicks
When an AI Overview is present, the top-ranking organic page sees a 58% lower average click-through rate (80).
"For every 100 clicks you could historically earn for a top-ranking page, Google now keeps 58
– Ahrefs, February 2026 (80).
AI Overview CTR impact by SERP position (December 2025):
Position
CTR Impact with AI Overview
1
−58.0%
2
−50.8%
3
−46.4%
4
−38.8%
5
−32.6%
6
−30.5%
7
−29.7%
8
−28.8%
9
−29.7%
10
−19.4%
Table 12: AI Overview click-through-rate impact by SERP position, December 2025. Source: Ahrefs. (80)
AI Overviews reduced clicks to top content by 34.5% in April 2025, and the impact worsened by December 2025 (80).
Per visit, users click a traditional result only 8% of the time when an AI summary is present, versus 15% without one; just 1% click a link inside the summary, and they are also more likely to end the session (26% vs 16%), according to a Pew Research Center study (March 2025 survey, published July 2025) (84).
In a 2025 HubSpot survey, 83% of website owners said traffic increased or stayed flat after AI features launched and only 8% reported a decrease, though a later HubSpot marketer survey found nearly 30% reporting declines (44).
For news-related terms, an AI answer pushed the first organic result down by an average of 980 pixels, about one full page scroll (85).
Kevin Indig study found 80% of users say they still click through to traditional results to verify information even when AI Overviews appear (42).
Who gets cited in AI Overviews
AI Overview citations increasingly rank in Google: BrightEdge found 54.5% rank organically somewhere, up from 32.3% at launch in May 2024, though only about 17% overlap with page-1 rankings (76, 86).
Still, ranking #1 never guarantees a citation: only about 1 in 5 AI Overview citations match a top-10 result (87). That page-1 overlap ranges from 24% in healthcare to 11% in finance, according to BrightEdge (76).
26% of brands have zero AI Overview mentions, while the top 50 brands account for 28.9% of all AIO citations (9).
43% of AI Overviews link to Google-owned properties, keeping users inside the Google ecosystem (83).
Google's official position: "The best practices for SEO continue to be relevant because our generative AI features on Google Search are rooted in our core Search ranking and quality systems." (88).
Google CTR Statistics
68.01% of US Google searches ended without a click in 2026, up from about 60% in 2024 and roughly 49% in 2019 (10).
The no-click pattern is sharpest on mobile: clickstream studies put zero-click at 77.2% on mobile versus 46.5% on desktop, and around 58–60% across the US and EU in 2024 (5).
Searches that trigger an AI Overview are more likely to be zero-click, with a 9–11 percentage-point gap versus non-AIO queries (89).
AI Mode is even more extreme: 93% of AI Mode searches end without a click (90).
According to First Page Sage's 2026 study of Google click-through rates by ranking position, CTR depends heavily on position and drops sharply down the page: the #1 organic result earns 39.8%, 18.7% at position 2 and 10.2% at position 3 (91).
Position
Google CTR (2026)
1
39.8%
2
18.7%
3
10.2%
Table 13: Google organic CTR by position, 2026. Source: First Page Sage (91)
The top 3 organic results capture 68.7% of all clicks, and position 1 alone draws more clicks than positions 3 through 10 combined (91).
75% of people never scroll past the first page of Google results (92).
By Ahrefs' measure, the average position-1 CTR for informational keywords fell from 0.076 in December 2023 to 0.039 in December 2025, and for AI Overview keywords from 0.073 to 0.016 (80).
Click-through rates declined nearly 30% from May 2024 to May 2025, with ranking-style content queries down 60% and comparison queries down 14% (67).
Among searches that do produce a click, organic results are the most common destination in both the US and Europe; in Europe, organic clicks land in the 44–47% range (16).
Want the bigger SEO picture beyond Google search data?
By SQ Magazine's measure, Google search intent splits roughly 60.5% informational, 26.4% transactional, and 13.1% navigational (5).
By Statista's index, the most popular Google queries are navigational: in 2024 "Google" itself ranked first, followed by "YouTube," another Google-owned property (14).
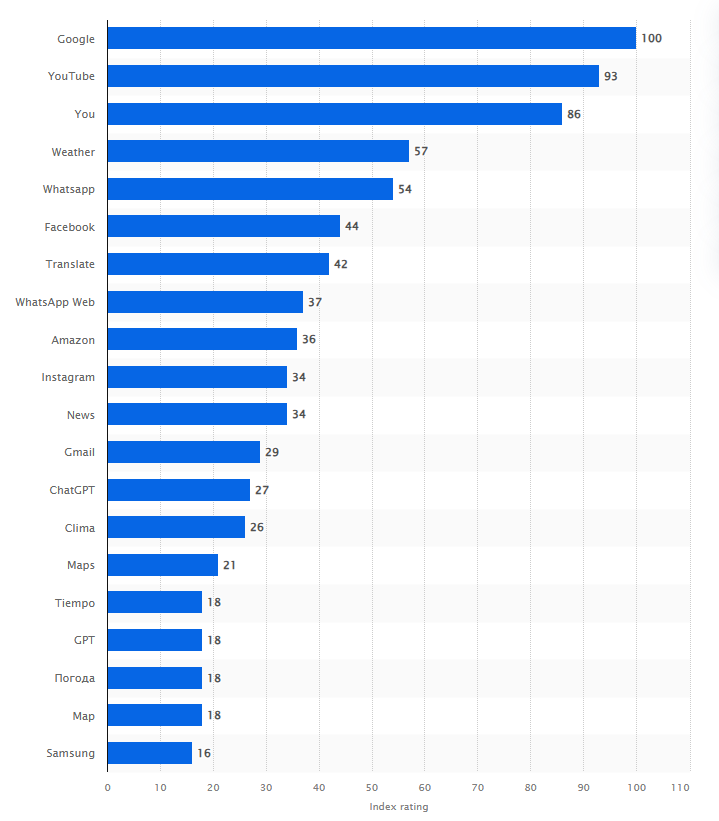
The most-searched Google queries worldwide in 2025 were "Google," "YouTube," "You," "Weather," "WhatsApp," "Facebook," "Translate," "WhatsApp Web," "Amazon," and "Instagram," with "ChatGPT" and "GPT" entering the ranking for the first time, according to Statista (93).
Figure 6. Most searched terms on Google worldwide in 2025, by index rating. Source: Statista. (93)
By search volume, SQ Magazine ranks "ChatGPT" among the most-searched keywords globally in 2025, at roughly 768 million searches per month (5).
94.74% of all keywords receive 10 or fewer monthly searches, and only 0.0008% get more than 100000 (94).
Only about 18000 keywords get more than 100000 monthly searches while roughly 2.3 billion get fewer than 10; even so, one- and two-word keywords still pull over 65% of all search volume (95).
Long-tail keywords (those with 1–100 monthly searches) make up 91.8% of all keywords but account for just 3.3% of total search volume, according to Backlinko's analysis of 306 million keywords (95).
A top-ranking page rarely ranks for just one term: by Ahrefs' study of 3 million searches, the average #1 page also ranks in the top 10 for nearly 1000 other keywords (96).
35% of desktop and 32% of mobile AI Overview keywords are question-format (who, what, why, when, how); the most common are "how," "what," and "is" (79).
Voice assistant use keeps rising, a rough proxy for voice search: the US is projected to reach 157.1 million voice assistant users in 2026, up from 142 million in 2022, according to Statista (97).
Google Crawl and Indexing Statistics
As of 2020, Google's search index held roughly 400 billion documents, drawn from trillions of crawled pages built up over more than 25 years (11).
In Google's crawling-and-indexing pipeline, the great majority of crawled webpages are labeled "spam, duplicates, and low-quality," with only a fraction selected into the search index, according to a DOJ antitrust affidavit from Elizabeth Reid, Google's head of Search (11).
96.55% of all pages in Ahrefs' index of about 14 billion pages receive zero organic traffic from Google, and another 1.94% get just 1 to 10 monthly visits (98).
When crawling for Search, Googlebot fetches only the first 2 MB of an HTML or text file and the first 64 MB of a PDF; anything beyond that is not processed, so keep critical content and tags high in the page (99).
Google uses two main methods to pull content into AI Overviews: Retrieval-Augmented Generation (RAG), which retrieves relevant pages through its ranking systems, and Query Fan-Out, which fires off related searches concurrently (88).
Googlebot has a major advantage over AI crawlers: it renders JavaScript through Google's infrastructure, while GPTBot, ClaudeBot, and PerplexityBot can fetch JavaScript files (10–25% of pages) but do not execute the code (100).
AI and search crawler traffic grew 18% from May 2024 to May 2025, with GPTBot alone up 305% in raw request volume; among the top 10,000 domains that have a robots.txt file, about 14% now carry directives targeting AI bots, per Cloudflare's 2025 crawler analysis (102).
By site reach (share of sites where the bot was seen), GPTBot was already the most widespread AI crawler in 2025, appearing on 4.5% of desktop and 4.2% of mobile sites, ahead of PetalBot (4.0% / 4.4%), ClaudeBot (3.6% / 3.4%), and CCBot (3.5% / 3.2%) (102).
Google Algorithm Updates
A core update is one of the broad, system-wide changes Google makes to its ranking algorithms several times a year to keep search results helpful and reliable. These updates do not target individual sites or pages, and they are not penalties. When a page slips, it usually means other content now answers the query better, not that the site did something wrong, and Google notes that most sites never notice an update at all (103).
How core updates differ from other Google updates
Named updates such as spam or Helpful Content updates target one specific factor and adjust a single algorithm. The October 2023 spam update, for example, mainly hit cloaked, hacked, auto-generated, or scraped content and left well-maintained sites untouched (104).
Core updates instead reevaluate dozens of ranking factors across the whole system at once, which is why they cause such broad SERP volatility. They roll out over one to two weeks with publicly announced start and end dates, while targeted updates are often unannounced. Recovering from a targeted update can be as simple as fixing the specific issue; core-update recovery needs holistic improvement to a site's overall quality, authority, and relevance (104).
The table below lists every confirmed Google Search ranking update across 2025 and 2026, including not just core updates but also spam updates and the February 2026 Discover update.
Table 14: All confirmed Google Search ranking updates, 2025–2026. Source: Google Search Status Dashboard. (105)
March 2025 core update
The first core update of 2025, rolling out over about two weeks (105).
Google framed it as part of a 2025 push to surface more content from a wider range of creators; analysts saw a rebalancing of user-generated content, with some forums losing prominence to more authoritative sources. Volatility was similar to December 2024's, with finance fluctuating most and travel least (106).
June 2025 core update
The second core update of 2025, taking about two and a half weeks (105).
Data providers called it "a big update": Semrush's Sensor spiked to 9.3 (extreme volatility) with broad swings and a rise in zero-click results. Sites with stronger E-E-A-T and SEO foundations proved the most resilient (107).
December 2025 core update
The third core update of 2025, an 18-day rollout during the holiday shopping peak (105).
Another highly volatile rollout (Semrush Sensor peaked at 8.7/10), with the focus landing on trust and E-E-A-T beyond traditional YMYL. eCommerce and retail recovered (fashion sites like Shein, Boohoo, and River Island gained 38–120%), while generalist retailers (H&M, ASOS, Marks & Spencer) lost 7.3–27.2%; Wikipedia was the biggest loser (down about 456 visibility points) and major UK news brands declined (108).
March 2026 core update
The first core update of 2026, completing in 12 days, starting two days after the March 2026 spam update finished (105).
More volatile than December's: 79.5% of top-3 URLs changed position (up from 66.8%), 90.7% shifted across the top 10, and 24.1% of top-10 pages fell out of the top 100 (12, 13).
May 2026 core update
The second core update of 2026, completing in 12 days. Google called it routine, but it was "a big one," with significant volatility on May 23 and again May 30 (105, 109).
Google reweighted results toward the source type a searcher most likely wanted for each query, market, and format. Of 8,887 domains analyzed mid-rollout, 5,039 gained visibility and 3,845 lost it; YMYL categories (gambling, health, finance), thin e-commerce pages, and aggregators were most sensitive, while AI content farms and repackaged-content sites were hit hardest (109).
Spam and Discover updates
Google also ran updates outside the core cycle. The August 2025 and March 2026 spam updates enforce Google's spam policies and strengthen automated spam detection, demoting pages that violate them. The February 2026 Discover update adjusted rankings in the Google Discover feed rather than classic web search (105).
How to track a core update's impact
Note the update's start and end dates from Google's Search Status Dashboard.
Wait at least a full week after the rollout completes, then in Search Console compare that week against a week before the update began to isolate what actually changed.
Review your top pages and queries: small moves (position 2 to 4) are normal, but large drops (position 4 to 29) warrant a closer look, and web, image, and video search should be analyzed separately.
For large drops, self-assess whether the affected content is genuinely helpful, reliable, and people-first. Recovery can take a few days or several months, and you don't have to wait for the next major core update, since smaller unannounced updates also open recovery windows (103).
How to stay resilient to core updates
Original and valuable information.
Content should provide original insight, analysis, research, examples, or practical recommendations rather than summarizing or rephrasing other sources.
What to do:
Include unique perspectives and expert analysis.
Use proprietary data, case studies, and survey findings.
Share real-world examples and lessons learned.
Avoid publishing content that only repeats what competitors have already covered.
Comprehensive topic coverage.
Content should address the topic thoroughly and answer the key questions users are likely to have, not just give a high-level overview.
What to do:
Structure content around users' main questions and needs.
Cover all essential aspects of the topic.
Include actionable guidance and supporting details.
Update content regularly to keep it accurate and relevant.
Expertise and trustworthiness (E-E-A-T).
Google prioritizes content that demonstrates experience, expertise, authoritativeness, and trustworthiness.
What to do:
Clearly identify content authors and their credentials.
Reference credible sources and industry research.
Support claims with evidence and data.
Strengthen brand authority through thought leadership and expert contributions.
First-hand experience.
The added "Experience" component of E-E-A-T rewards content based on direct, real-world experience and original knowledge.
What to do:
Showcase customer stories, testimonials, and reviews.
Share practical insights from internal experts.
Publish original research and proprietary findings.
Use real examples and lessons from actual projects.
User-first content.
Content should be created to solve user problems and meet audience needs, rather than written primarily to target keywords and rankings.
What to do:
Focus on customer pain points and search intent.
Create content that provides practical value and clear answers.
Prioritize user satisfaction over keyword density.
Measure success through engagement and usefulness, not rankings alone.
Avoid search-engine-first content.
Google discourages content created mainly to manipulate rankings, including mass-produced pages, low-value AI-generated content, and articles written to hit arbitrary word counts.
What to do:
Publish content only when it adds genuine value.
Avoid creating content solely to capture search traffic.
Review and refine AI-assisted content before publishing.
Focus on quality and usefulness rather than content volume.
Strengthen technical SEO.
Google says core updates are about content and helpfulness, not technical fixes, so technical SEO won't by itself drive core-update recovery. Treat it as baseline hygiene that supports user experience and helps search engines crawl and understand your site.
What to do:
Improve page load speed and Core Web Vitals.
Implement structured data where relevant.
Build a logical internal linking structure.
Maintain a clean, up-to-date XML sitemap.
Ensure mobile usability and proper indexability across the site.
Final Thoughts
Google remains the largest search engine in the world and holds the biggest share of the search market. For businesses, that makes the priority clear: understand Google's core ranking factors and what it rewards, so your content meets those expectations and delivers real value to the people who find it.
But Google is no longer the only place people search, and AI search keeps growing. A strategy that works in 2026 has to plan for both. The statistics in this report capture where Google search stands today and point to where to focus next: track these trends, invest in genuinely helpful, high-quality content, and stay visible across both Google and AI search as user behavior keeps shifting.
{{post-cta}}
Frequently Asked Questions
What is the most searched thing on Google?
The most searched terms are dominated by navigational and brand queries rather than complex topics. According to Statista, in 2024 "Google" itself was the single most popular query on Google, followed by "YouTube," another Google-owned property, and in the US the top recurring searches are led by "weather," "Google," "YouTube," "Amazon," and "news". Among trending keywords, SQ Magazine ranks "ChatGPT" as one of the most-searched terms globally in 2025, at roughly 768 million searches a month.
What is the most searched question on Google?
Google does not publish a single definitive ranking, but the most-asked questions are consistently short, informational ones, and "how to..." and "what is..." remain the dominant question formats. This fits Google's overall intent mix: according to SQ Magazine, about 60.5% of all searches are informational.
What is the most searched word on Google?
Single-word searches are led by navigational terms people use to reach a specific site. Statista's data shows that "Google" and "YouTube" topped global single-word queries in 2024, while "weather" is the most searched single word in the US.
How can you see how many times a word has been searched on Google?
Google does not show exact counts directly, but you can estimate search volume with a few tools. Google Trends shows relative interest over time, Google Ads Keyword Planner gives volume ranges for advertisers, and third-party SEO tools like Ahrefs, Semrush, and Moz provide estimated monthly search volumes for specific keywords.
How many Google searches happen per day and per second?
Google processes an enormous volume of queries every day. According to Google's own 2025 count, it handles more than 5 trillion searches per year, about 14 billion per day and roughly 158,548 per second.
Why does Google dominate the search engine market?
Google's dominance comes largely from default placement and scale. SQ Magazine reports that around 4.82 billion devices use Google as their default search engine, and StatCounter data shows Android powers about 68% of the world's smartphones with Google Search built in, while Chrome holds over 70% of the browser market with Google as its default. Combined with a vast index and decades of ranking refinement, this keeps Google the default starting point for most searches.
What are other search engines besides Google?
According to StatCounter (May 2026), the largest alternatives by worldwide market share are Bing (5.03%), Yahoo (1.40%), Yandex (0.99%), DuckDuckGo (0.71%), and Baidu (0.53%). As Search Engine Journal notes, DuckDuckGo is a privacy-first engine that does not track users, and Baidu leads in China; AI tools like ChatGPT and Perplexity are also emerging as a parallel search layer.
Are Google searches declining?
No. The total number of Google searches is still growing year over year, and Google remains the world's most-used search engine. What is changing is where attention goes: zero-click searches and AI tools are capturing more of it, and according to HubSpot, nearly 30% of marketers report decreased search traffic as users turn to AI. Google's share of the broader search market is softening, even as raw query volume rises.
What was the first-ever Google search?
According to the widely retold origin story, the first query run on Google was the name "Gerhard Casper," then president of Stanford University, during a 1998 demo by founders Larry Page and Sergey Brin. Google returned results about the person, while the leading engine of the day, AltaVista, surfaced pages about "Casper the Friendly Ghost," showing off Google's link-based ranking.
The numbers in this report all point the same way. Google still owns the demand, but earning visibility there now takes serious effort and investment in quality content and a healthy technical foundation. That is what we do. Foursets designs, builds, and migrates websites on Webflow, and runs SEO strategies built for how search actually works in 2026. If you are planning a migration, a rebuild, or a serious push on organic growth, let's talk.