Search is not dying. It is fragmenting. Most teams are still optimizing for a SERP that no longer exists.
This article covers 300+ verified SEO statistics for 2026, sourced from primary research by Search Engine Journal, Ahrefs, BrightEdge, HubSpot, Statista, IAB, and peer-reviewed academic sources. No recycled blog round-ups, no uncited claims.
These search engine statistics for 2026 are for marketing leads, CMOs, founders, and in-house SEO leads who need defensible numbers to brief leadership, justify budgets, or plan editorial calendars. If you are sizing a 2026 strategy on SEO, this is the dataset.
Top SEO Statistics
The numbers every 2026 SEO conversation starts with.
- Google holds 90.02% of global search engine market share across all devices (April 2026, Statista). (28)
- U.S. search advertising revenue reached $114.2 billion in 2025, the largest single digital advertising category at 38.8% of total digital revenue. Global search engine ad spend reached $352 billion in the same year. (11, 18)
- In a HubSpot survey of 336 web professionals, 26% ranked Google Search as their single biggest traffic driver – more than any other channel. Paid social and paid search each ranked second at 10%. (19)
- Gartner predicts traditional search volume will drop 25% by 2026, with organic search traffic declining by over 50% as consumers shift to AI-powered search. (6)
- AI Overviews now appear in over 11% of Google search queries, a 22% increase since launch in May 2024. Longer, complex queries triggering AI Overviews grew 49% since May 2024. (15)
- Approximately 60% of searches yield no clicks. When an AI summary is present, only 8% of users click traditional links, versus 15% without an AI summary. (22)
- Average web search traffic declined 21% year-over-year. AI-driven traffic increased 9.7x in the same period. (20)
- When an AI Overview is present, the top-ranking organic result sees a 58% lower average click-through rate (Ahrefs, December 2025, 300,000 keywords analyzed). Position-1 CTR for AI Overview keywords fell from 0.073 in December 2023 to 0.016 by December 2025. (10)
- AI Overview CTR impact by SERP position (December 2025): Position 1: -58.0%, Position 2: -50.8%, Position 3: -46.4%, Position 4: -38.8%, Position 5: -32.6%. (10)
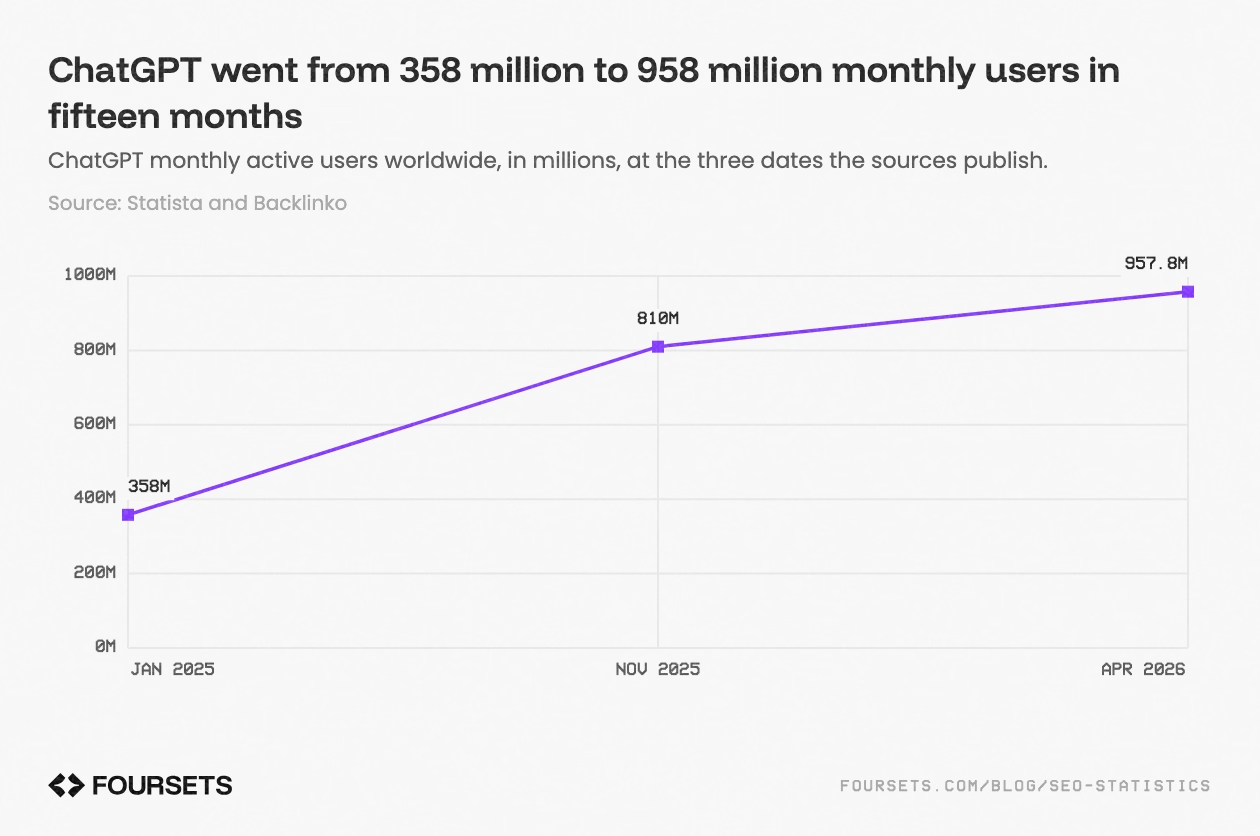
- As of April 2026, ChatGPT was the most popular AI application worldwide with approximately 957.8 million monthly active users. (38)
- Google sends 345 times more website traffic than ChatGPT, Gemini, and Perplexity combined. AI tools represent approximately 0.1% of all web referral traffic. (20)
- AI search traffic grew 527% year-over-year, from 17,000 to 107,000 sessions (January-May 2024 vs. January-May 2025). (22)
- AI search visitors convert 23x better than traditional organic search visitors, generating 12% of all signups from 0.5% of total traffic in one controlled study. (20)
- 96.55% of all pages in Ahrefs' index receive zero organic traffic from Google. Study analyzed approximately 14 billion pages. (67)
- 80% of AI-cited sources don't appear in traditional Google search results. Only 12% of AI-cited sources match Google's top results. (20)
- 66.3% of SEO professionals identify original content creation as their highest-impact activity. 77.9% fear AI-generated answers will reduce clicks to their sites. (1)
- 65% of SEO professionals expect no reduction in SEO investment over the next 12 months. Only 13.5% anticipate a decrease. (1)
- A 2024 peer-reviewed meta-analysis of 10 SEO studies measured SEO's overall impact on marketing outcomes and found a mean effect size of d = 1.049 – a "very strong" result by academic standards, meaning SEO consistently outperforms most other marketing tactics in controlled research settings. (8)
- In 2024, 43% of websites reported year-over-year organic traffic growth. 44% remained stable. 14% experienced declines. (19)
- The median SEO salary in 2024 was $82,000. VP of SEO averaged $191,850. Both are above the U.S. national average of $63,795. (3)
📖 Looking for statistics beyond SEO – across paid, social, email, and content?
See the full picture in our Complete Digital Marketing Statistics for 2026 →
Search Engine Market Share Statistics
The global search market is not a level playing field. Here is where each engine stands, and what the numbers mean for how you build visibility.
Global search engine market share by referrals, all devices (April 2026, Statista) (28):
| Search Engine | Global Share |
|---|---|
| 90.02% | |
| Bing | 5.14% |
| Yahoo | 1.50% |
| Yandex | 1.19% |
| DuckDuckGo | 0.71% |
| Baidu | 0.46% |
Table 1. Global search engine market share by referrals, all devices, April 2026. Source: Statista. (28)

Google is not just the market leader. It is the default state of the internet for most of the world:
- Google holds over 90% of the global search engine market across all devices (26).
- In the United States, Google commands 86.71% across all devices and handles over 60% of all search queries (26, 45).
- On U.S. mobile, Google holds 94%+ of market share (46).
- Google's global mobile search market share stands at 93.89% (49).
- Google's global desktop share dipped to 78.8% in January 2025, its lowest level in more than 15 years (27).
- Google processes approximately 13.7 billion searches per day and 5 trillion annually (53, 62).
- India generates 1.5 billion Google search queries daily and has over 840 million monthly Google users (53).
- In India, Google's market share exceeds 90% (29).
- Android powers 72%+ of global smartphones, meaning Google search is the default on most devices people pick up every day (50).
- "ChatGPT" was the most-searched keyword globally on Google in 2025, with approximately 768 million monthly searches – a sign of how deeply AI tools have entered mainstream awareness (53).
Bing
Bing is a distant second, but its reach in specific contexts makes it worth tracking:
- Bing holds 5.14% of global search market share and 12.21% on desktop worldwide (28).
- In the U.S., Bing reached ~7.5% across all devices in April 2025 and surpassed 10% on desktop, one of its highest-ever figures (26, 45).
- China generates more than 25% of Bing's worldwide traffic; the United States accounts for almost 22% (30).
- Bing powers ChatGPT's web search index and Microsoft Copilot, meaning content ranking on Bing has a direct pathway into AI-generated answers (52).
Yahoo
- Yahoo holds 1.50% of global search market share and 2.86% in the U.S. (28, 52).
- Yahoo search results are powered by Bing through a long-standing partnership, using the same index and ranking algorithms. No separate Yahoo optimization playbook is needed (52).
Yandex
- Yandex holds 1.19% of global search market share but dominates its home market, commanding approximately 72% of Russian searches and used by over 63% of Russian internet users (26, 28, 52).
- In 2023, a 44GB source code leak exposed over 17,800 ranking factors, providing unprecedented visibility into a major search algorithm (52).
- Yandex places greater weight on geolocation, domain age, content freshness, and user behavior signals than Google (52).
DuckDuckGo
- DuckDuckGo holds 0.71% of global search engine referral share (Statista, April 2026) and 2.12% in the United States as of December 2024 (28, 84).
- It does not track users or build advertising profiles. Results draw from Bing's index and DuckDuckGo's own web crawler (52).
- DuckDuckGo has built a consistent following in GDPR-regulated European markets (52).
Baidu
- Baidu holds 0.46% of global search market share but commands 53%+ of the Chinese domestic market (28, 52).
- Its ERNIE Bot AI assistant reached 200 million monthly active users by January 2026 (52).
- Ranking in Baidu requires content in Mandarin, hosting on China-accessible servers, and compliance with Chinese internet regulations (52).
AI Search vs Traditional Search
- Google sends 345 times more website traffic than ChatGPT, Gemini, and Perplexity combined (20).
- Global search engine use has declined 3.5 percentage points since early 2021, despite continued user growth (17).
- Traditional search is declining gradually but still commands the vast majority of search activity in the U.S. and Europe (2).
What This Reveals
Google's monopoly shows its first measurable cracks. Desktop share is at a multi-decade low and Bing is at historic highs. But cracks are not collapse. AI tools drive a fraction of a percent of web referrals. For 2026, the implication is clear: optimize for Google first, and build AI visibility as the second priority. Do not rebalance the budget based on a fraction of a percent of referral share.
Google Search Statistics
Google is not just the dominant search engine. It is the infrastructure the web runs on.
- Google holds over 90% of the global search engine market across all devices (26).
- Google processes 5 trillion searches per year – approximately 13.7 billion per day (53, 62).
- Google.com receives over 3 billion unique monthly visitors and averages 83 billion visits per month (17, 25).
- 4.82 billion devices globally use Google as their default search engine (53).
- In a HubSpot survey of 336 web professionals, 26% ranked Google Search as their single biggest traffic driver – ahead of paid social and paid search (10% each) (19).
- Google sends 345 times more website traffic than ChatGPT, Gemini, and Perplexity combined (20).
- In both the U.S. and Europe, Google retains approximately 95% of desktop search userbase and search events, almost flat over Q2 2024 through Q2 2025 (2).
- Google handles over 60% of all search queries in the United States (26).
- In January 2025, Google accounted for 93.89% of the global mobile search engine market, maintaining a margin of more than 93 percentage points over all competitors since January 2015 (49).
- The average Google user performs 3–4 searches per day. Gen Z users average 5+ (53).
- Google search activity by vertical in the US: Google Homepage 86.94%, Google Images 10.62%, Google Video 1.16%, Google Maps 0.64%, Google News 0.38%, Google Shopping 0.23% (53).
- India generates 1.5 billion Google search queries daily and has 840+ million monthly Google users (53).
- In the United Kingdom, Google's mobile search market share reached 97.55% in January 2025 (51).
- Google Lens processes over 25 billion visual searches per month (53).
- "ChatGPT" was the most searched keyword globally on Google in 2025, with approximately 768 million monthly searches – and in 2024, "Google" itself was the most popular search query on the platform, followed by "YouTube," also a Google-owned property (28, 53).
- Google's global desktop share dipped to 78.8% in January 2025, the lowest level in more than 15 years (27).
"Google dominates. No one is taking share from them in meaningful ways. If you want to appear in traditional web search – and you should, because 99% of people still use it to find what they're seeking on the web – Google remains an undisputed monopoly."
– Rand Fishkin, Co-founder & CEO, SparkToro (2)
What This Reveals
Google is not a channel you optimize for. It is the default state of the web. The numbers do not show a company in decline. They show a monopoly that is still setting the terms.
User Behavior Statistics
How people search has always been the foundation of SEO strategy. Here is what the data shows about where habits stand – and where they are shifting.
- Over 80% of online adults globally use search engines at least once a month (17, 18).
- Around 15 million U.S. users already use AI as their primary search method (34).
- The average user performs 3–4 Google searches per day. Gen Z averages 5+ (53).
- Google search intent breakdown: 60.5% of queries are informational, 26.4% transactional, 13.1% navigational (53).
- Across all search engines, purchase-intent queries remain below 2.1% of total searches (2).
- As of Q2 2023, 44% of shoppers worldwide start their online shopping journey on a search engine; 41% go directly to a specific online store (56).
- 33%+ of online adults discover brands through search engines; 50%+ use search to research brands before making a decision (17).
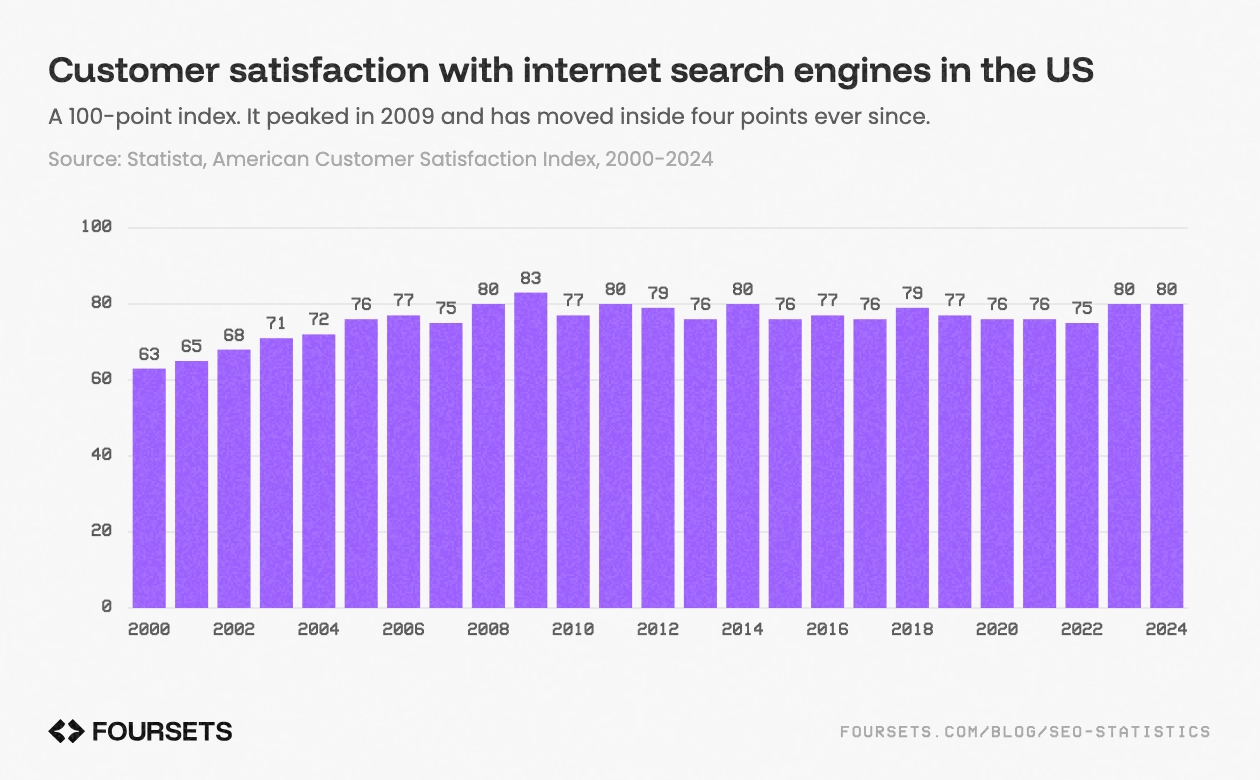
- Customer satisfaction with internet search engines in the U.S. reached 80 out of 100 index points in 2024, up from 63 in 2000 (55).
Zero-click behavior is growing and reshaping what a "successful search" means for publishers:
- 58.5% of U.S. searches and 59.7% of EU searches end without a click. On mobile, the zero-click rate reaches 77.2%; on desktop, 46.5% (53).
- When an AI Overview is present, only 8% of users click traditional organic links, down from 15% without an AI summary (22).
- 80% of consumers use AI summaries for at least 40% of their searches; among general users, only about 19% click through to the sources cited in AI Overviews. (22)
When users do click, here is where they go:
- In the US, YouTube holds the #1 spot for post-search destinations, followed by Reddit at #2. Social platforms – YouTube, Reddit, Instagram, Facebook – collectively dominate where search traffic lands (2).
Gen Z is the leading indicator for where search behavior is heading:
- Almost half of Gen Z users use social search as their primary method for finding information online (54).
- In the US (April 2024): 40% of Gen Z searched for gift ideas and beauty content on TikTok; 27% searched for fashion brands on Instagram; 66% used Google for restaurants, bars, and local services (57).
Here is the full breakdown by search topic across TikTok, Instagram, and Google, according to Statista (57):

| Topic | TikTok | ||
|---|---|---|---|
| Gift ideas | 40% | 19% | 28% |
| Hair and makeup | 40% | 25% | 25% |
| Well-being and fitness | 39% | 20% | 29% |
| Recipes and meal ideas | 38% | 19% | 30% |
| Fashion brands | 36% | 27% | 29% |
| Interior design | 33% | 21% | 29% |
| Video games/gaming | 33% | 14% | 36% |
| Parenting advice | 27% | 11% | 35% |
| News and current affairs | 22% | 18% | 43% |
| Sports latest news and updates | 20% | 17% | 43% |
| Cars | 18% | 16% | 46% |
| Financial services | 17% | 11% | 54% |
| Electronics | 16% | 12% | 60% |
| Restaurants and bars | 15% | 14% | 66% |
| Local services | 12% | 12% | 66% |
Table 2. Most popular search topics among Gen Z adults in the U.S. by platform, April 2024 (share of respondents). Source: Statista. (57)
What This Reveals
Search behavior has not collapsed – it has fragmented. Usage is high, satisfaction is back near its 2009 high, and search remains the dominant starting point for both research and shopping. But the edges are shifting. Zero-click is rising. Gen Z is splitting attention across platforms. A growing share of users has already moved AI to the top of their search stack. For SEO, the implication is not panic – it is precision. The users who still click are more intentional. Winning their click matters more than it ever did.
AI Overviews & AI Search Statistics
AI is not replacing search. It is changing what happens inside of it – and for publishers, the difference matters.
AI Overviews: Scale and Reach
- Google states AI Overviews are "used by more than a billion people." As of 2026, monthly reach has grown to 2 billion users (20, 22, 23).
- AI Overviews now appear in over 11% of Google queries, a 22% increase since their debut. Longer queries trigger them most: 25% of searches with 8 or more words now show an AI Overview (15, 24).
- Total Google search impressions increased 49% since May 2024 – more searches, fewer clicks (15).
- AI Overview coverage varies sharply by industry: entertainment queries saw 175% growth in AIOs, travel 108%, while B2B technology queries showed only 7% (5).
The Click Penalty
- AI Overviews reduce clicks to top-ranking content by 58% as of December 2025, up from 34.5% in April 2025 (10).
- CTR impact by position when an AI Overview is present (December 2025): Position 1: -58.0%, Position 2: -50.8%, Position 3: -46.4% (10).
- Overall click-through rates declined nearly 30% since May 2024 (15).
"For every 100 clicks you could historically earn for a top-ranking page, Google now 'keeps' 58."
– Ahrefs (10)
That traffic did not disappear; it redirected. Users did not stop searching – they started searching differently.
- Traditional web search traffic declined 21% over the same period; AI-driven traffic increased 9.7x (20).
- AI search traffic grew 527% year-over-year: from 17,000 to 107,000 sessions (January–May 2024 vs. January–May 2025) (22).
- Search queries that triggered an AI Overview showed a 9–11 percentage point higher zero-click rate than non-AIO queries (36).
- Click-through is rarer still for links placed inside an AI summary itself: as few as 1% of users click them (54).

That said, the impact has not been uniform across all publishers:
- 83% of website owners reported traffic either increased or remained unaffected after AI features were introduced. Only 8% reported decreased traffic (19).
AIO Triggers, Citations, and Ranking Patterns
- Query intent distribution for AIO-triggering queries: 88% informational, 8.69% commercial, 1.76% transactional. 80% of desktop AIOs target informational keywords; transactional keywords account for less than 10% (13, 22).
- 82% of desktop AIOs appear for keywords with fewer than 1,000 monthly searches – AI Overviews are a long-tail phenomenon (13).
- 35% of desktop AIO keywords are question-format queries (who, what, why, when, how) (13).
- Top industries triggering AI Overviews on desktop: Health (#1), People & Society (#2), Science (#3) (13).
- Average AI Overview length: 119 words on desktop, 91 words on mobile (13).
- Exact match keywords appear in only 5.4% of AI Overviews. Writing for AI citation means writing clearly, not writing for keyword density (5).
Who gets cited is a separate question from what triggers an AIO.
- 46% of desktop top-ranked organic results appeared in AI Overviews; 34% on mobile (13).
- 54.5% of AI Overview citations now rank organically – up from 32.3% at launch. May 2024: 32.3% → January 2025: 45.2% → September 2025: 54.5% (16).
- Only 16.7% of AIO citations come from top 10 ranking positions. Positions 21–100 are the primary source of citation overlap (16).
- 80% of AI-cited sources do not appear in traditional Google search results at all (20).
- Average AI Overview contains 11 links; 20–26% overlap with the top 10 organic results (13).
- 26% of brands have zero mentions in AI Overviews. The top 50 brands account for 28.9% of all AIO citations (20).
- 43% of AI Overview links point to Google-owned properties (5).
- AIO citation overlap by industry (September 2025): Healthcare 75.3%, Education 72.6%, B2B Tech 71.0% (16).
- Quora is the most-cited domain in Google AI Overviews. Reddit ranks second (14).
- ChatGPT Search cites pages ranking in positions 21+ approximately 90% of the time. Pages in positions 1–10 are cited far less frequently (14).

"Being the cited source is quickly becoming the new form of ranking."
– Lemuel Park, Co-Founder & CTO, BrightEdge (6)
"72% of B2B buyers encounter AI Overviews and 90% click through to cited sources."

– Google, cited by SEJ (5)
AI Search Tools: Adoption and User Trust
- ChatGPT reached approximately 957.8 million monthly active users as of April 2026, up from 810 million in November 2025 and 358 million in January 2025 (32, 38).
- Roughly 3 out of 10 internet users worldwide used ChatGPT in the past month as of Q4 2025, up from 16.9% in Q1 2024 (33).
- ChatGPT gathered 1 million users in 5 days and 100 million users within two months of its November 2022 launch – the fastest consumer app adoption on record (31).
- In February 2026, ChatGPT's mobile app registered over 7 million downloads in the US; Google's Gemini registered 4.8 million in the same period (37).
- In 2024, 15 million U.S. adults used generative AI as their primary online search tool. By 2028, this figure is projected to reach 36 million (34).

- 94% of AI search referrals originate from desktop. Google is the only major AI search platform with a mobile traffic majority at 53% (5).
- 79% of consumers are expected to use AI-enhanced search within the next year; 70% already trust AI-generated results (6).
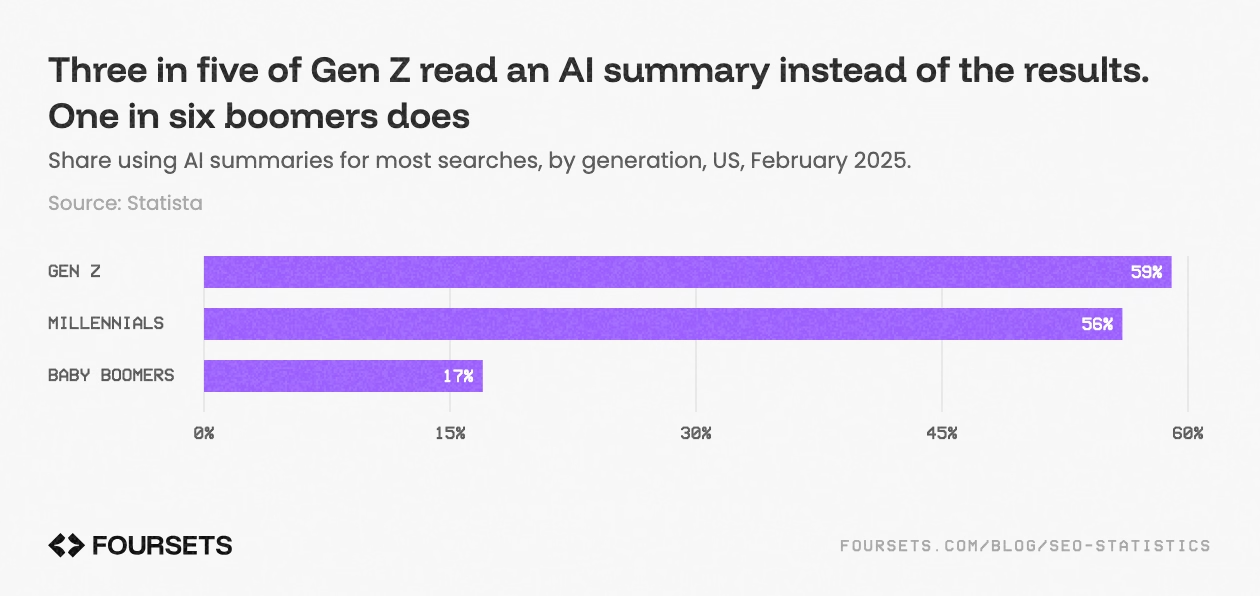
- AI summary usage by generation (US, February 2025): 59% of Gen Z and 56% of Millennials use AI summaries for most searches. Only 17% of Baby Boomers say the same (35).
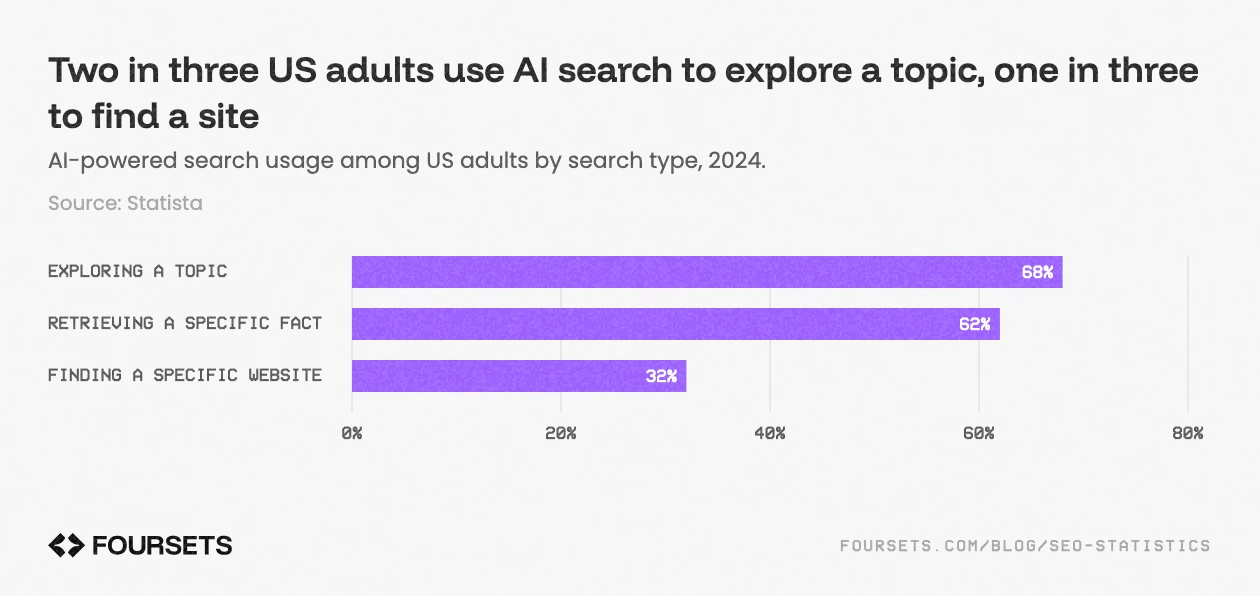
- 68% of U.S. adults used AI-powered search for exploring new topics in 2024; 62% for retrieving specific information; 32% for finding a specific website (48).
- 80% of consumers use AI summaries for at least 40% of their searches; among general users, only about 19% click through to the sources cited in AI Overviews. (22).
- 70% of users read only the first third of an AI summary (22).
- Only 9% of users always trust AI-generated answers. Over 80% remain at least somewhat skeptical; 40%+ have encountered inaccurate or misleading content in AI responses (22).
What This Reveals
AI Overviews are already the infrastructure of search for over a billion users. The click penalty is documented and accelerating. But the opportunity is real: citation overlap between AIOs and organic results is growing every quarter, and the brands earning AI visibility are not always the ones ranking in the top 10. The game has expanded. Winning it means being findable by machines, not just by people clicking blue links.
AI search is changing where your buyers look – most SEO strategies haven't caught up yet.
We broke it down in our podcast episode From SEO to AEO: AI Website Optimization →
SEO ROI & Effectiveness Statistics
SEO budgets live or die on one question: what does the channel actually return? Here is what practitioners measured, what conversion data shows, and where the attribution still breaks down.
What SEO Actually Delivers
SEJ's State of SEO 2026 survey asked 371 professionals what improved most directly from their SEO work in the past year.
The outcomes:
- Organic traffic growth: 60.6%
- Keyword rankings improvement: 57.7%
- Brand visibility increase: 34.8%
- Lead generation and conversions: 34.0%
- Content engagement enhancement: 25.1%
- No measurable improvement: 9.2% (1)

In a 2023 survey, 50% of marketing professionals said SEO had a large positive impact on marketing performance and goals. More than 4 in 5 noticed a positive impact overall. (59)
SEO also delivered nearly 5x more return on ad spend at a fraction of paid media costs, according to a 2025 Search Engine Land analysis. (58)
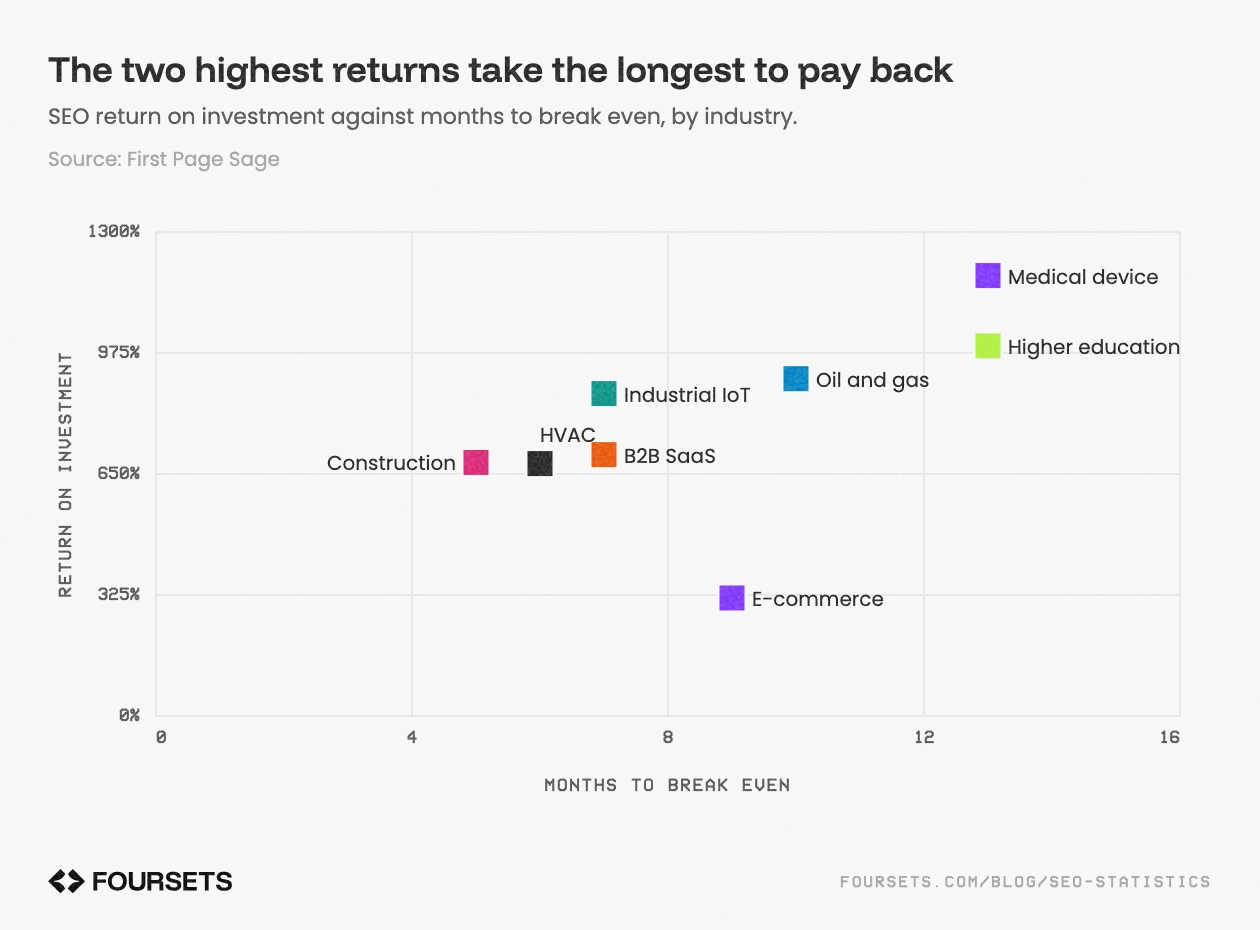
ROI benchmarks by industry, with breakeven timelines:
- Medical Device: 1,183% ROI – 13-month breakeven
- Higher Education: 994% ROI – 13-month breakeven
- Oil & Gas: 906% ROI – 10-month breakeven
- B2B SaaS: 702% ROI – 7-month breakeven
- E-commerce: 317% ROI – 9-month breakeven (60)
Workshop Digital achieved 67% more leads and 11% higher ROI after using CallRail's conversation intelligence to align SEO content to real customer search language. (5)
Webistry increased conversions by 400% after identifying messaging gaps and optimizing lead follow-up through the same approach. (5)
A Fortune 500 company that shifted its model to digital grew recurring revenue from $0.9 billion to $8.4 billion, per KPMG research. (7)
We studied the SEJ SEO Trends 2026 report. Patrick Reinhart, VP of Services and Thought Leadership at Conductor, frames how SEO value accumulates across the funnel:
"The real value lies not only in the conversion event but in how SEO, content, and wider brand touchpoints shape awareness, preference, and credibility over time."
– Patrick Reinhart, VP of Services & Thought Leadership, Conductor (4)
The Attribution Problem
Most SEO teams measure the wrong things, or fail to connect their metrics to business outcomes.
- Only 21.8% of SEO professionals include ROI in their measurement framework. Organic traffic (74.9%) and keyword rankings (56.9%) dominate instead. (1)
- 28.6% cite ROI attribution difficulty as a top challenge to SEO success. (1)
- 36.9% flag attribution as a future risk to the channel's standing inside their organization. (1)
- 60.4% track qualified leads and conversions as a primary KPI, but only 33.7% plan to invest in conversion-focused SEO. Teams measure business outcomes without building strategies to drive them. (1)

SEJ's State of SEO 2026 captures what is usually missing from these conversations. Katie Morton, Editor-in-Chief of Search Engine Journal, puts it plainly:
"Conversions have never been more important."
– Katie Morton, Editor-in-Chief, Search Engine Journal (4)
Patrick Reinhart, VP of Services and Thought Leadership at Conductor, identifies the structural reason SEO keeps losing the budget argument:
"Leadership buy-in and education is the most overlooked factor in SEO success. For pretty much my entire 20+ year career, there has been very little attention or investment given to the organic space. The rise of AI search is an unprecedented opportunity for the community to get in front of C-level leadership and help explain the importance of the channel and why folks in our positions are vital to the digital success of the organization."
– Patrick Reinhart, VP of Services & Thought Leadership, Conductor (1)
SEO Investment Trends
Despite widespread concern about AI disrupting organic search, SEO investment held steady through 2025.
- Looking back: 56.6% of organizations reported no reduction in SEO investment over the past year. (1)
- Looking ahead: 65% expect stable or increased investment over the next 12 months. Only 13.5% expect cuts. (1)
- 18.1% reallocated resources to other channels, 17.0% canceled or downgraded tools, 15.1% reduced internal headcount. (1)
John Shehata, CEO and Founder of NewzDash, argues that stability should not be mistaken for safety:
"Depending solely on search traffic and digital ads is increasingly risky. Explore new revenue streams like commerce, events, subscriptions, newsletters, premium content, licensing, and community monetization. Google is not your business model. It's just a channel."
– John Shehata, CEO and Founder, NewzDash (1)
AI's Impact on SEO ROI
AI search may reduce organic traffic volume. The visitors it sends convert at rates that make the channel worth building for deliberately.
- The average AI search visitor is worth 4.4x more than the average traditional organic search visitor, based on conversion rate analysis. AI channels are projected to drive similar economic value to traditional search by end of 2027. (14)
- AI search visitors convert 23x better than traditional organic visitors (Ahrefs). AI-referred traffic generated 12% of signups while representing only 0.5% of total traffic. (20)
- Almost 70% of businesses report higher ROI from using AI in SEO. AI referral traffic delivers 27% lower bounce rates for retail sites and 38% longer session durations. (22)
- 29% of marketers report a significant ROI increase from AI in SEO; 39% report a moderate increase. Only 1% say AI reduces SEO ROI. (60)
What This Reveals
SEO produces measurable business outcomes, but most teams still report on visibility metrics instead of revenue. The channels paying attention to AI-referred traffic are already seeing conversion rates that outperform traditional organic by a significant margin. The ROI is there. The gap is in attribution discipline and getting that story in front of leadership before the budget conversation happens.
Industry & Business Spending Statistics
Here is what businesses actually spend on SEO, how budgets shifted in 2024–2025, and what the data shows about the relationship between spend and results.
The SEO Market
The SEO services industry is large and still growing.
- Businesses in the U.S. spend approximately $119.4 billion annually on SEO and digital marketing consulting (2025). (60)
- A 2025 Search Engine Land analysis found that 82.5% of marketers increased their SEO budgets in 2024. (61)
What Companies Actually Pay
Most businesses spend less on SEO than the channel returns – and the ones who spend more get significantly better results.
According to a Backlinko survey, small business SEO spending breaks down as follows:
- 50% spend less than $1,000/year on SEO
- 14% spend $5,000 or more per year
- 2% spend over $25,000 annually (60)
- The average small business spends $497.16/month on SEO services. (60)
Agency vs. freelancer pricing:
- Agencies are 2x more likely than freelancers to charge $1,000–$2,000/month. Freelancers are most commonly paid in the $500–$1,000/month range. (60)
- 24% of businesses working with agencies spend $10K–$25K annually, compared to just 2% of those working with freelancers. (60)
Spending and Results
Higher SEO investment correlates directly with satisfaction.
- Clients spending over $500/month on SEO were 53.3% more likely to be "extremely satisfied" with results
- Those spending under $500/month were 75% more likely to be dissatisfied (60)
SEO vs. The Paid Media Budget
SEO competes for budget with paid media. The data makes the comparison stark.
- Paid media currently dominates marketing spend at approximately 31% of the total marketing budget (2.4% of company revenue). Gartner notes CMOs are "getting less for every dollar spent" due to media price inflation. (58)
- Up to 59% of CMOs report having insufficient budget to execute their full marketing strategy in 2025. (58)
- Despite the budget pressure, SEO delivered nearly 5x more return on ad spend at a fraction of paid media costs, according to a 2025 study. (58)
What This Reveals
The SEO industry is not contracting. Budgets grew in 2024 and confidence is holding into 2026. The structural problem is not investment levels. It is allocation: too much goes to paid media with declining efficiency, and too little goes to a channel that compounds over time and consistently outperforms on return.
Ranking Statistics
Getting to the top of Google is harder than it used to be. Here is what the data shows about click distribution by position, how difficult ranking actually is, and what signals move the needle.
CTR by Position
Position determines how much of the available traffic you capture. The overall average across all positions is 13% – but the breakdown by position shows how steep the drop-off is.
- As of 2023, the average SEO click-through rate across all positions was 13% (median: 8%). (19)
- Position 1: 39.8% CTR. Position 2: 18.7%. Position 3: 10.2%. (53)
- Featured snippets outperform all organic positions with an average CTR of 42.9%. (53)
- Mobile CTR on Google is 9.7% lower than desktop CTR. 58% of B2B search queries originate from desktop devices. (53)
How Hard Is It to Rank
- 39% of SEO professionals find ranking in the top 10 "somewhat" or "extremely" difficult, up from 35% in 2023. (19)
- 51% of websites rank on page two or beyond. (19)
- 59.3% of SEO professionals cite algorithm volatility and SERP disruptions as their greatest ongoing challenge. (1)
What Actually Moves Rankings
Content and links:
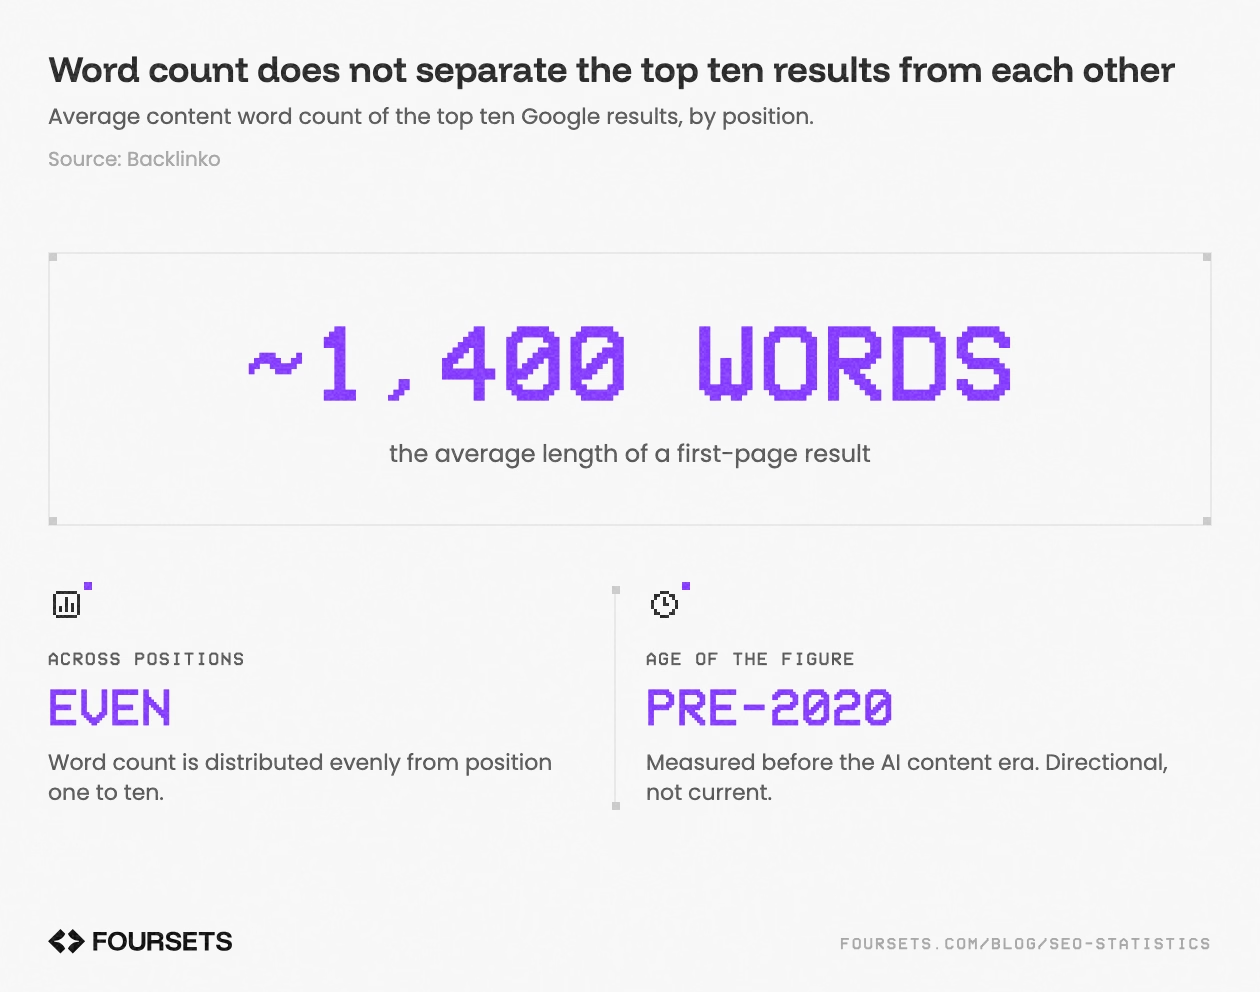
- The average first-page Google result is approximately 1,400 words in length – a figure from pre-2020 research that predates the AI content era; treat as a directional benchmark. (9)
- The number of referring domains is one of the most important ranking factors, confirmed by an industry study of 11.8 million Google Search results. (9)
- Featured Snippets are selected based on a combination of content length, formatting, page authority, and HTTPS usage. (9)
Behavioral signals:
- Organic CTR for a keyword can contribute to a SERP boost for that specific query, according to Google. (9)
- Bounce rate shows a significant correlation with Google rankings in Semrush's large-scale data analysis. (9)
- Google uses direct traffic data from Chrome to evaluate site quality. The Semrush study found a significant correlation between direct traffic volume and rankings. (9)
- Dwell time – how long a user stays on a page after clicking from Google – is a strong behavioral signal. Longer dwell time correlates with higher rankings. (9)
What SEO Professionals Prioritize
- Top SEO metrics tracked in practice: keyword rankings (20%), organic pageviews (12%), click-through rate (9%). (44)
- Most effective SEO strategies in 2025: optimizing for search intent (21%), on-page content with keywords (20%), keyword research (20%), mobile optimization (19%), AI for SEO improvement (19%). (19)
- 22% say aligning content with E-E-A-T and search intent is their top priority for the coming year. Technical SEO and performance followed at nearly 13%. (43)
Mordy Oberstein, Head of SEO Branding at Wix, explains why the industry's focus on E-E-A-T is not just a compliance exercise:
"It's not an accident that Google added an 'E' to E-E-A-T for 'experience.' It wants quality raters to evaluate a page from an experience perspective because it has determined this is what users are looking for."
– Mordy Oberstein, Head of SEO Branding, Wix (6)
What This Reveals
The drop-off from position 1 to position 3 is steep. Featured snippets and top positions deliver multiples of what mid-page results get. More than half of websites are stuck on page two. The signals that matter most are increasingly behavioral – direct traffic, dwell time, and CTR – not just technical compliance. Google is measuring what users actually do, not just what the page says.
SEO Content Statistics
Content creation is the highest-impact SEO activity in 2026 and the hardest to scale. 74% of new web pages now involve AI at some stage of production (20). The industry is still sorting out what that means for quality, trust, and rankings.
Activities with the greatest positive impact on SEO outcomes in the past 12 months (SEJ survey, 371 professionals across 52 countries):
- Original content creation delivered the highest positive impact of any activity: 66.3% of SEO professionals named it their most effective tactic (1)
- Content updates ranked second at 42.6%, outperforming keyword optimization (24.5%) and backlink acquisition (16.4%) (1)
Content creates more operational pressure than any other SEO function. The most time-consuming SEO activities to scale:
- Content creation 42.6%, link acquisition 38.8%, strategic content planning 38.0%, content optimization 29.4% (1)
- The top three scaling challenges are all content-related: creation, planning, and optimization together constrain most SEO operations (1)
- 32.1% of SEO professionals cite content workflow challenges as a top obstacle to SEO success, second only to algorithm volatility (1)
- 23.5% of SEO specialists fear diminishing content performance despite increased SEO efforts, reflecting saturation in information-only content formats (1)
AI-assisted production is now the industry standard. What the data shows on AI content and its presence in search results:
- 87% of marketers use AI tools for content creation (20)
- 74% of newly published web content includes AI assistance. Only 26% is entirely human-authored (20)
- 86.5% of the top 20 ranking pages contain at least some AI-generated text (20)
- 17.31% of top-ranking search result pages are primarily AI-generated, up from 2.27% in 2019. Two-thirds of those pages ranked within two months of publication (22)
- AI-generated content costs approximately $131 per post, compared to $611 for human-written content (20)
- AI-written content without human editing fails to build trust. Studies show consumers can detect AI-generated content and may develop negative feelings toward brands that use it. (5)
- 58.5% of SEO professionals plan to focus on human-authored content supported by AI tools (1)
- Only 22.4% plan to rely primarily on AI-generated content (1)
Search engines are evaluating content differently than they did three years ago. What the research shows:
- AI search systems analyze semantic relationships between concepts, not keyword frequency. Studies confirm AI crawlers prioritize natural writing over repetition. Building content on a scaffold of high-volume keywords conflicts with how these systems actually read the page (5)
- Google classifies keyword-stuffed, made-for-search-engine content as spam. Building content on a scaffold of tool-prescribed keywords is a liability, not a foundation (4)
- 49.6% of SEO professionals plan to invest in E-E-A-T reinforcement next year. 33.2% are prioritizing topical authority and content architecture (1)
Roger Montti, News Writer at Search Engine Journal, on what separates content that ranks from content that does not:
"The authenticity, authoritativeness, and completeness of the information provided to the user are important."
– Roger Montti, News Writer, Search Engine Journal (4)
AI is absorbing the informational queries that top-of-funnel content used to capture. What the data shows:
- 77.9% of SEO professionals fear AI-generated answers will reduce website clicks. (1)
- Traditional top-of-funnel content is losing visibility. Users now ask AI the same questions that on-site evergreen and informational content used to answer. That doorway to the site is closing (4)
Tom Capper, Senior Search Scientist at STAT Search Analytics + Moz, on what this structural shift means:
"The rapid decline in informational search traffic (aka 'the Great Decoupling') will have far-reaching implications, inside and outside of SEO, and has only just begun. Within SEO, top-of-funnel content has long been a scalable tactic, especially for agency teams, and no longer looks like such an obvious win."
– Tom Capper, Senior Search Scientist, STAT Search Analytics + Moz (1)
- According to a Search Engine Land analysis by Dale Bertrand, middle-of-the-funnel content formats – comparison pages, niche buying guides, and Q&A pages – rank better and convert more effectively than generic educational blog posts. As AI handles direct informational queries, traditional top-of-funnel content is losing its return on investment (63)
- The best-performing content formats in intent-driven SEO are comparison content, niche buying guides, interactive tools (ROI calculators, pricing estimators), and video-first content. These formats are tied to decisions, not just information (63)
- 73% of marketers are now prioritizing content optimized for AI-generated answers (12)
What This Reveals
Original content is still the top SEO activity. The format of that content is what is shifting. Pure information articles built to capture search volume are the category under pressure. Content that shows real experience, moves users toward decisions, and demonstrates depth that AI cannot replicate is taking its place. Volume is easier to produce than ever. Distinctiveness is harder. That gap is where rankings are now being decided.
On-Page SEO Statistics
On-page SEO covers everything controlled inside the page itself: title tags, heading structure, content layout, internal links, and schema markup. These signals are still foundational. They are also the easiest to get wrong.
The page-level signals that consistently appear in ranking factor studies:
- Keyword in the title tag is one of the most important on-page signals. Title tags that begin with a keyword tend to outperform those where the keyword appears later in the tag (9)
- H1 tags function as a second title tag. Google uses the H1 as a secondary relevancy signal alongside the title tag, confirmed by correlation study (9)
- Having a target keyword appear in the first 100 words of a page correlates with first-page Google rankings (9)
- Internal linking strategy delivered a measurable positive SEO impact for 22.9% of professionals in 2025. Structured data and schema markup delivered positive impact for 21.8%, outperforming backlink acquisition (16.4%) (1)
- In practice, these fundamentals are still widely missed: H1 tags are absent on 29% of pages, and meta descriptions are missing on ~32% of all pages analyzed. Title tags, by contrast, are present on 98.6% of pages. (69)
- Google likely treats unlinked brand mentions – brand name appearances without a hyperlink – as a brand signal, according to Backlinko's analysis of ranking factors (9)
A technically correct page that matches the wrong intent will not rank. How Google distributes and personalizes results:
- 60.5% of Google queries are informational, 26.4% transactional, 13.1% navigational. Each intent type requires a structurally different page (53)
- According to Briskon's enterprise SEO analysis, search results are increasingly personalized by user intent, device type, location, and browsing patterns. Undifferentiated content is becoming less competitive at scale (7)
- On-page engagement ranks as the fifth most-tracked SEO metric, cited by 20.8% of professionals. Measuring how users interact with the page after landing is now a standard part of on-page evaluation (1)
On-page structure also determines how AI systems read and surface content:
- AI systems prioritize direct answers and structured formatting over narrative prose. Tables, lists, and schema markup receive higher weight when LLMs extract and cite page content (5)
What This Reveals
Title tags, H1 structure, and keyword placement in the opening paragraph still move rankings. Internal linking and schema markup consistently outperform link acquisition in practitioner-reported impact data. The larger shift is intent: page structure and technical correctness are table stakes, but a page that answers the wrong query will not rank regardless of how well it is optimized. Google is reading device type, location, and past behavior to serve personalized results – which means a single undifferentiated page is competing at a disadvantage across an increasingly fragmented results landscape.
Keyword Statistics
Keyword research remains the foundation of SEO targeting. What is changing is which keywords matter for which outcome: traditional clicks versus AI Overview visibility. The data shows these are increasingly different targets.
- Google processes more than 5 trillion searches per year – the first official update since 2016, when the confirmed figure was 2 trillion (62).
- 94.74% of all keywords receive 10 or fewer monthly searches. Only 0.0008% of keywords get more than 100,000 monthly searches (64)
- 82% of desktop AI Overviews and 76% of mobile AI Overviews are triggered by keywords with fewer than 1,000 monthly searches (13)
- 68%+ of all AIO-triggering queries have 100 or fewer monthly searches. Most keywords that earn AI visibility have near-zero volume by traditional research benchmarks (22)
- AI Overviews now appear in 25% of searches using keywords of 8 or more words. Google increased AI Overview presence in long-tail queries by up to 100% between September and December 2024 (24)
- According to Semrush's 2026 AI SEO analysis, 88% of AIO-triggering queries are informational. Commercial intent accounts for 8.69%, transactional 1.76%, navigational 1.43% (22)
- A Semrush study of 200,000 AI Overviews found 80% of desktop AI Overviews targeted informational keywords (76% on mobile). Transactional keywords appeared in fewer than 3% of cases (13)
- 35% of desktop and 32% of mobile AI Overview keywords are question-format queries – "who," "what," "why," "when," "how." The three most common triggers: "how," "what," and "is" (13)
- Exact match keywords appear in only 5.4% of AI Overviews. AI systems extract answers based on semantic meaning, not keyword pattern matching (5)
- Queries for ranking-style content ("best X", "top 10 X") decreased 60% since May 2024. Comparison queries decreased 14% in the same period. Click-through rates declined by nearly 30% over the same period. (15)
- Since the launch of AI Overviews, the volume of commercial queries on Google has increased, according to Google's own statement (62)
Darrell Tyler, Senior Manager of Organic Growth at CallRail, on where keyword strategy needs to shift:
"The age of information articles is fading quickly. Focus on topics or queries that help searchers discover the brands and product solutions they need. Queries that stimulate purchase decisions have a stronger CTR due to the needs that information alone doesn't serve. 'Best' lists, brand comparisons, and more help users get closer to making those decisions."
– Darrell Tyler, Senior Manager, Organic Growth, CallRail (1)
What This Reveals
The traditional keyword research playbook – find high-volume terms, optimize pages, rank, get clicks – is not broken. It is splitting into two separate objectives. High-volume transactional and commercial keywords still drive clicks and conversions through organic results. Low-volume informational and question-format keywords increasingly drive AI Overview visibility instead. These are different audiences with different behaviors. A keyword strategy that serves both needs to treat them as separate targets, not a single ranked list.
Link Building Statistics
Backlinks remain one of Google's most influential ranking signals. The data also shows that most pages never acquire any, and that the gap between pages that rank and pages that don't is largely a backlink gap.
- Backlinks function as votes of confidence. The more high-quality backlinks a page earns, the higher it tends to rank (9)
- The number of referring domains is one of the most important ranking signals in Google's search engine algorithm, based on an industry study of 11.8 million Google search results (9)
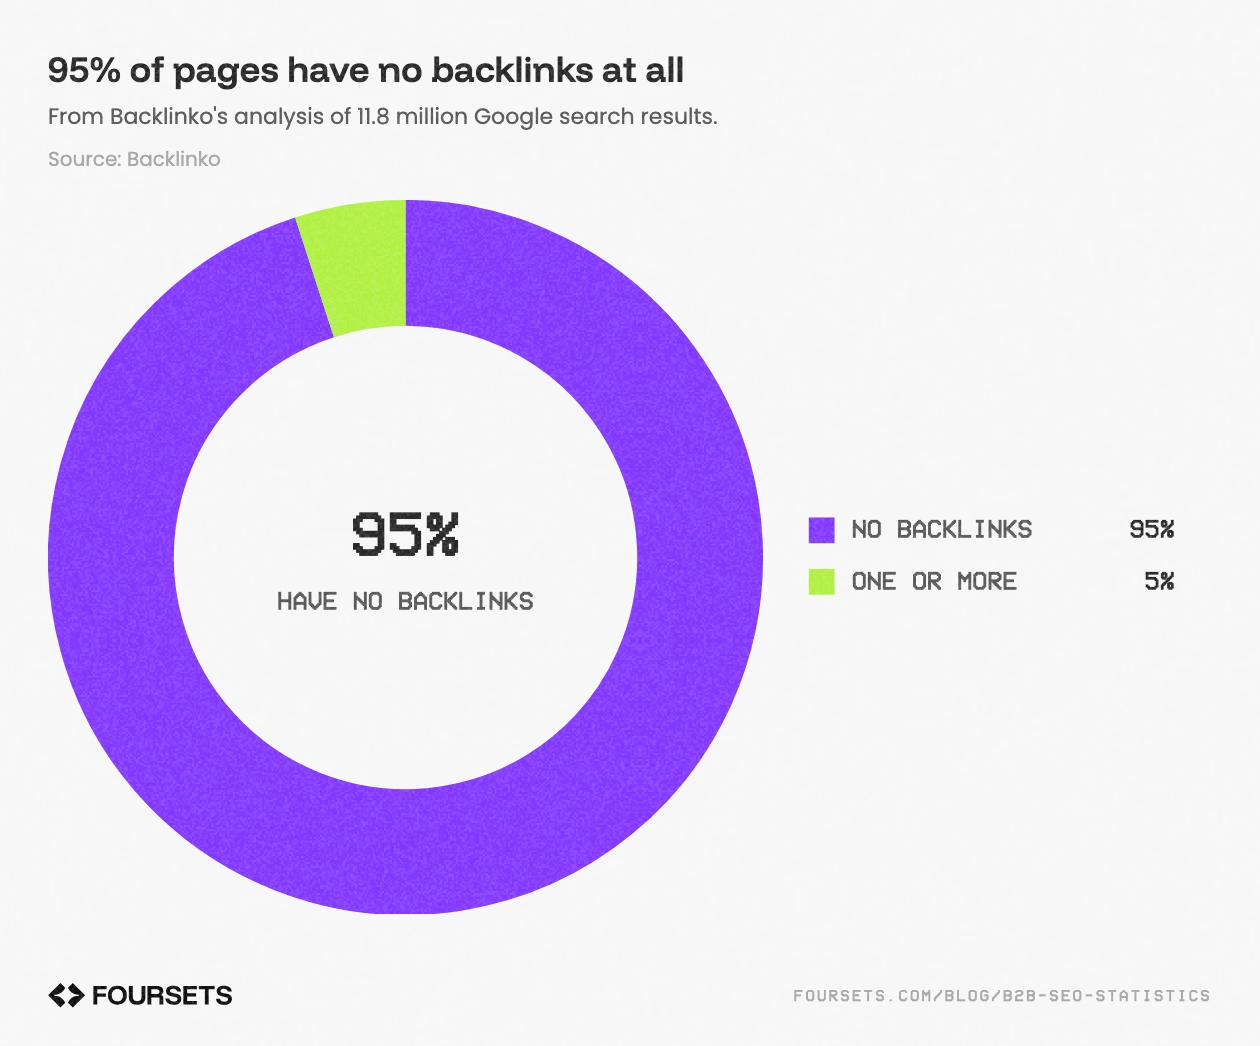
- Approximately 95% of all web pages have zero backlinks. The #1 result in Google has 3.8x more backlinks than positions #2–#10, and 3x more referring domains. Both figures are from Backlinko's study of 11.8 million search results (65)
- 96.55% of all pages get zero organic traffic from Google. 1.94% receive between 1 and 10 monthly visits. Study analyzed approximately 14 billion pages (67)

- 54.5% of AI Overview citations now come from pages that also rank organically – up from 32.3% at launch in May 2024, a 22-percentage-point increase over 16 months (16)
- AIO citation overlap timeline: May 2024 = 32.3% → September 2024 = 39.1% → January 2025 = 45.2% → September 2025 = 54.5% (16)
- According to an Authoritas study cited by Search Engine Land, only 1 in 5 links cited in Google's AI Overviews matched a top-10 organic result. 62.1% of cited links or domains didn't rank in the top 10 at all (68). This does not contradict the 54.5% figure above – Row429 counts any organic ranking position; Row606 counts only the top 10.
- AI Overviews include an average of 11 links per result on both desktop and mobile. 20–26% of those links overlap with the top 10 organic results (13)
- Content longer than 3,000 words receives 77.2% more referring domain links than content shorter than 1,000 words, based on analysis of 912 million blog posts (66)
What This Reveals
Most pages never earn a single backlink. The ones that do earn links dominate rankings by a wide margin. That dynamic is not changing – but what counts as a link is expanding. AI Overviews cite sources the same way journalists cite sources: based on credibility and relevance, not just position. Building genuine authority through backlinks increasingly serves both objectives at once. Ranking and being cited by AI are becoming the same goal.
Technical SEO Statistics
- Technical SEO defines the floor. A page with strong content and backlinks will not rank if it cannot be crawled, indexed, or loaded quickly enough. The data shows most sites have more technical debt than they realize.
- Page speed is a confirmed ranking factor for both Google and Bing. Google measures actual loading performance using real Chrome user data, not lab simulations (9)
- As page load time increases from 1 second to 3 seconds, bounce probability increases by 32%. At 5 seconds, it increases by 90% (70)
- Core Web Vitals are "more than a tiebreaker" in terms of their impact on rankings (9)
- CWV thresholds (Google): LCP ≤ 2.5 seconds, INP ≤ 200 milliseconds, CLS ≤ 0.1 (21)
- Google measures CWV at the 75th percentile of page loads, segmented across mobile and desktop. A page passes only when all three metrics meet their thresholds at that percentile (21)
- Only 48% of mobile sites and 56% of desktop sites pass all three Core Web Vitals. LCP is the weakest metric on mobile: only 62% pass (69)
- By metric (mobile / desktop): LCP 62% / 74%, INP 77% / 97%, CLS 81% / 72% (69)
- 91.7% of desktop pages use HTTPS – a confirmed Google ranking signal, though Google classifies it as a tiebreaker. Home pages lag behind at 84.6% (9, 69)
- 68% of pages use canonical tags. 98.6% have a title tag. Only 71% have an H1. Only 67.7% have a meta description – 32% of sites leave this field empty (69)
- Most major AI crawlers can fetch JavaScript files but do not execute the code. GPTBot, ClaudeBot, and PerplexityBot do not fully render JavaScript – dynamically loaded content may be invisible to AI search systems. Googlebot retains a significant rendering advantage (70)
- 13% of sites return a 404 error for their robots.txt file – crawlers encounter a missing file on roughly 1 in 7 sites (69)
- GPTBot is blocked in robots.txt on 4.5% of sites (up from 2.9% in 2024). ClaudeBot on 3.6% (nearly doubled from 1.9%). llms.txt – the emerging standard for AI crawler instructions – is present on only 2.13% of sites (69)
- Google does not require llms.txt or any other AI-specific file to appear in generative AI search. Google may crawl and index many file types beyond HTML, but those files receive no special treatment in AI ranking (85)
- Technical SEO ranks as one of the top three most requested skills in SEO job postings, alongside content marketing and data analytics. Demand for technical SEO grew at the fastest rate of any skill in Q4 2024, rising from 71% to 75% of job listings (3)
- The same skills command the highest salaries: Technical SEO, Data Analytics, AI, and Stakeholder Management top the list of higher-paying SEO skill sets (3)
Dan Taylor, Partner and Head of Innovation at SALT.agency:
"At its core, the internet has not changed shape. The way crawlers and websites operate remains much the same, so technical SEO will continue to be essential. What is shifting is how we measure SEO success."
– Dan Taylor, Partner & Head of Innovation, SALT.agency (4)
What This Reveals
More than half of mobile sites fail Core Web Vitals. One in seven sites has a broken robots.txt. A third of pages have no meta description. These are not edge cases – they are the median state of the web. Technical SEO is the most demanded skill in the industry for a reason: the gap between a technically sound site and an average one is still wide enough to be a competitive advantage. The AI layer adds a new dimension – JavaScript rendering and crawler access now affect visibility in AI search, not just Google.
📥 Putting all of this into action takes more than reading stats.
Want a step-by-step playbook? Download our free AEO + SEO Checklist → built to help you rank in both AI Overviews and classic Google.
Mobile SEO Statistics
Mobile is the primary surface for web access globally. Google completed its switch to mobile-first indexing in 2023 – meaning the mobile version of a site is now the baseline for how Google crawls, indexes, and ranks content.
- More than half of all searches are conducted from mobile devices. Google now penalizes websites that are not mobile-friendly (9)
- 5.78 billion unique mobile users globally – 70.1% of the world's population. Smartphones represent 86.9% of all mobile handsets (18)
- Mobile's share of global web traffic has grown from 3% in 2010 to 58.5% in 2025 – the majority of internet traffic shifted to mobile in under two decades (40)
- In Q1 2026, mobile devices accounted for 52.27% of global website traffic, down from 62.39% in Q1 2025 – reflecting a partial desktop recovery as AI tools drive more desktop sessions (39)

- In April 2025, Google held over 94% of the U.S. mobile search market. DuckDuckGo and Yahoo! each held approximately 2.1%. Google Search reaches 66% of U.S. mobile audiences – making it one of the most-used mobile apps in the country (46)
- Google holds 93.89% of the global mobile search engine market. Its lead over competitors has exceeded 93 percentage points continuously since January 2015 (49)
- 77.2% of mobile searches are zero-click – users get their answer without visiting any site. On desktop, the zero-click rate is 46.5% (53)
- Mobile CTR on Google is 9.7% lower than desktop CTR. 58% of B2B search queries originate from desktop devices (53)
- 27% of mobile search queries on Google are voice-based. Google processes over 1 billion voice searches monthly. 76% of "near me" voice queries are directed at finding local businesses (53)
- 94% of AI search referrals originate from desktop, not mobile – suggesting AI-driven search is still predominantly a desktop behavior (5)
- In 2025, 19% of SEO professionals cited mobile optimization as a highly effective strategy – tied with AI for SEO improvement. Search intent optimization ranked first at 21% (19)
What This Reveals
Mobile is the dominant access point for the web, but it is also the surface where users engage least deeply – zero-click rates on mobile are nearly double those on desktop. Optimizing for mobile is not optional, but the goal is not just to be present on mobile: it is to be the answer that appears before a user needs to click. Voice search and local intent make up a significant portion of mobile queries, and they require different content strategies than desktop-oriented SEO.
Voice Search Statistics
Voice search has moved from novelty to habit. People ask their devices questions while driving, cooking, and walking – and search engines have adapted to answer in kind.
- 58.6% of U.S. residents have tried voice search at least once. Over 1 billion voice searches are made every month globally (71)
- 27.6% of global internet users aged 16–64 use voice assistants weekly. In the US, 23.7% of internet users aged 16+ use voice assistants on a weekly basis (72)
- 98 million people in the US own a smart speaker in their household. 86.1 million US users actively ask questions via voice (72)
- Voice assistant usage spans generations but skews younger: Millennials 61.9%, Gen Z 55.2%, Gen X 51.9%, Baby Boomers 31.5% use voice assistants monthly in the US (72)
- 27% of all mobile search queries on Google are voice-based. 76% of "near me" voice queries are directed at finding local businesses (53)
- 21% of US consumers have completed a voice-assisted purchase. 38.8 million US smart speaker users engage in shopping-related voice activities (72)
- Voice searches frequently end without a click. Users get spoken answers directly from voice assistants, leaving no pageview, session, or referral data in analytics (5)
- Voice search is projected to reach 162.7 million US users by 2027, up from 149.1 million in 2024, and become a $45 billion channel by 2028 (71, 72)
What This Reveals
Voice search is a zero-click environment by design. The voice search answers are spoken – no link, no visit, no attribution. For SEO, this means voice search optimization is less about traffic and more about being the source an assistant chooses to read aloud. Featured snippets, structured data, and local business profiles are the primary levers. Brands that show up in voice search results build recognition without a click ever happening.
Video SEO Statistics
YouTube is not just a video platform – it is a search engine used by nearly half the internet. For brands that think only in blue links, video is the largest underinvested search surface in SEO.
We studied the Datos State of Search Q2 2025 report. Rand Fishkin, who analyzed cross-platform search behavior across the US and Europe, frames the competitive scale of YouTube in search directly:
"YouTube is, arguably, the second largest search engine in the world (behind only Google). But if we compared apples to apples, even for informational and commercial searches, it's possible that Reddit and Pinterest belong in the top 10 as well. If you're in marketing now, I'd take a close look at your audience and whether their search behavior might be happening even more on content and social platforms vs. traditional search or AI tools – you might be surprised."
– Rand Fishkin, Co-founder & CEO, SparkToro (2)
- YouTube has 2.58 billion active users as of October 2025. 42.8% of all global internet users access it every month – 63% of all YouTube views come from mobile devices (74)
- YouTube held the #1 position in both US and European search destination rankings in Q2 2025, with Reddit climbing to #2 in both regions (2)
- If YouTube were a standalone platform, it would rank as the sixth largest digital property in the United States. YouTube videos are now cited directly in Google's AI Overviews (6)
- YouTube maintains consistent user reach above 70% among US desktop users – more than any other content platform (2)
- 85% of people have been convinced to buy a product or service by watching a video. 96% have watched an explainer video to learn more about a product or service (75)
- 63% of consumers say they would most like to learn about products through a short video (75)
- Younger generations have reduced trust in Google SERP results due to manipulated content and fake reviews – driving them toward TikTok and YouTube for product research and discovery (4)
- 29–40% of US shoppers aged 18–34 used social media and video platforms for shopping inspiration and product research in 2024 (47)
- 91% of businesses use video as a marketing tool. 82% upload to YouTube specifically – making it the dominant platform for business video (75)
- 82% of video marketers report a good ROI from video. 83% say video directly increased sales. 85% say it helped generate leads (75)
What This Reveals
YouTube is the second-largest search engine in the world and the most underinvested SEO channel relative to its audience size. A brand that only publishes written content is optimizing for a fraction of the surfaces where its audience searches. Video content compounds differently than text – it earns visibility in AI Overviews, appears in video carousels, and builds brand awareness on platforms Google itself sources for answers. The question is not whether video SEO matters – it is whether your content strategy reflects where people actually look.
Local SEO Statistics
Local search connects intent to action faster than any other SEO channel. Someone searching "near me" is not browsing – they are deciding. These statistics show how that decision plays out.
- 46% of all Google searches have local intent. 80% of US consumers search for local businesses online at least once a week. 32% look up local business information daily or multiple times daily (76)
- 76% of consumers who search "near me" visit a related business within 24 hours. 88% of smartphone users conducting local searches visit a store within one week (76)
- 42% of local searchers click results within the Google Maps Pack. 72% use Google Search and 51% use Google Maps specifically for local business information (76)
- 20% of local mobile searches result in a purchase within one day. 60% of mobile users contact businesses directly through organic search results – via call, directions, or message (76)
- Businesses with complete Google Business Profile listings are 2.7x more likely to be viewed as reputable and 50% more likely to be considered for a purchase (76)
- Among US consumers aged 18–24, Instagram (67%), TikTok (62%), and Google Search (61%) are used in near-equal measure for local business discovery (76)
- 97% of consumers read reviews for local businesses. 41% always read reviews when browsing – up from 29% in 2025. 93% have made a purchase after reading positive reviews (77)
- 49% of consumers trust online reviews as much as personal recommendations. 85% are more likely to use a business after reading positive reviews. 77% are deterred by negative ones (77)
- 92% of consumers care about star ratings. 31% will only use businesses rated 4.5 stars or higher – up from 17% in 2025. 68% require a minimum 4-star rating, up from 55% in 2025 (77)
- 45% of consumers now use ChatGPT or AI tools to find local reviews – up from just 6% in 2025. 82% read AI-generated review summaries (77)
- 89% of consumers expect business owners to respond to reviews. 19% expect a same-day response – up from 6% in 2025. 80% are more likely to use a business that responds to all reviews (77)
- 69% of consumers wrote a review for a local business in the past 12 months. 83% wrote a review after being asked (77)
What This Reveals
Local SEO has the shortest path from search to sale of any SEO channel – but the margin for error is small. A missing Business Profile or a below-threshold star rating can close the door before a visit ever happens. Reviews are no longer a supporting signal – they are the primary trust mechanism, now amplified by AI that summarizes them before a user reads a single word. For younger consumers, the discovery layer is already shifting away from Google toward social platforms. Local SEO in 2026 is as much about reputation management and structured presence as it is about rankings.
SEO Statistics by Industry
The averages don't tell the story. E-commerce, B2B, SaaS, and healthcare each have distinct search patterns, buyer journeys, and ranking dynamics. Here is what the data shows by vertical.
First Page Sage analyzed organic search campaigns across 50+ companies to benchmark average monthly traffic and annual growth by industry. Here is what they found (86):

| Industry | Avg Monthly Sessions | Annual Growth |
|---|---|---|
| Entertainment | 31,247 | 67% |
| Pharmaceutical | 24,781 | 22% |
| eCommerce | 24,572 | 38% |
| Higher Education & College | 24,335 | 26% |
| B2B SaaS | 21,410 | 41% |
| PCB Design & Manufacturing | 20,017 | 29% |
| Software Development | 19,704 | 44% |
| Cybersecurity | 19,450 | 36% |
| Automotive | 16,017 | 29% |
| IT & Managed Services | 12,206 | 45% |
| Aerospace & Defense | 12,115 | 37% |
| Real Estate | 11,733 | 31% |
| Legal Services | 11,704 | 21% |
| Commercial Insurance | 11,295 | 39% |
| HVAC Services | 11,103 | 30% |
| Construction | 10,602 | 99% |
| Solar Energy | 10,551 | 30% |
| Industrial IoT | 9,897 | 92% |
| Financial Services | 8,921 | 35% |
| Oil & Gas | 8,023 | 55% |
| Manufacturing | 8,014 | 37% |
| Medical Device | 7,980 | 40% |
| Transportation & Logistics | 7,907 | 35% |
| Biotech | 7,443 | 108% |
| Engineering | 7,109 | 29% |
| Environmental Services | 6,710 | 36% |
| Aviation | 6,129 | 30% |
Table 3. Average organic traffic benchmarks by industry – monthly sessions and annual growth rate. Source: First Page Sage. (86)
E-commerce SEO
- E-commerce now accounts for more than 23% of global retail sales. The average e-commerce site conversion rate is under 2%. Smartphones drive 78% of all retail website visits (79)
- 44% of online shopping journeys begin with a search engine. 41% go directly to a specific store. 35% of global consumers prefer marketplaces as their primary source of shopping inspiration (41, 56)
- Amazon.com receives approximately 2.7 billion monthly visits – the most visited e-commerce platform globally. Five Amazon subdomains rank among the world's 20 most visited retail sites (42)

- Over 80% of US shoppers aged 35+ use Amazon for shopping inspiration; 62%+ use it for product research. Among shoppers aged 18–34, 29–40% use social media and video platforms for both purposes (47)
- AI referral traffic to retail sites generates 27% lower bounce rates and 38% longer session durations compared to non-AI traffic on the same sites (22)
B2B SEO
- 96% of B2B buyers do their own independent research before ever speaking with a sales representative (78)
- Website, blog, and SEO is the #1 ROI-generating channel for B2B brands. Nearly 70% of B2B marketers say leads arrive later in the purchase cycle because buyers have already completed AI-assisted research (79)
- B2B Tech has one of the highest AI Overview citation overlaps at 71% – meaning organic rankings and AIO visibility are closely aligned in this vertical (16)
- 58% of B2B search queries originate from desktop devices – significantly higher than the consumer average (53)
Healthcare SEO
- 61% of patients use the internet when researching healthcare providers. Nearly 80% used two or more online resources during their search. 69% of millennials seek medical advice online before seeing a doctor (81)
- 72% of patients check online reviews before selecting a new medical provider. 37% will not see a doctor who has no online presence (81)
- Healthcare has the highest AI Overview citation overlap of any industry at 75.3% – meaning the gap between organic rankings and AIO inclusion is narrower here than anywhere else (16)
- Pharmaceutical sites are among the highest-traffic verticals at 24,781 average monthly organic sessions – second only to Entertainment (31,247) and ahead of e-commerce (24,572) and B2B SaaS (21,410) (86)
SaaS SEO
- The global SaaS market is projected to reach $818.8 billion by 2029; a separate Grand View Research forecast puts growth at 13.7% a year from 2023 to 2030. North America accounts for 44% of global SaaS revenue (82)

- Global SaaS spending reached $247.2 billion in 2024 – a 20% year-over-year increase. SaaS now represents 36.6% of all cloud services and more than half of the overall software market (80)
- There are more than 42,000 SaaS companies worldwide. The average organization runs 112 SaaS apps – up from 80 in 2020. 86% of enterprise buyers plan to raise or maintain their SaaS budgets (80)
- High-growth SaaS companies spend more than 50% of revenue on sales and marketing – making organic search one of the few acquisition channels that scales without proportional cost increases (82)
- 76% of SaaS companies have launched or are planning AI-powered features. As products converge, content and SEO become a primary differentiation lever (82)
📖 With 42,000+ SaaS companies competing for the same organic traffic, your website is as important as your SEO strategy.
See how the best agencies approach SaaS web design: Best SaaS Web Design Agencies →
SEO ROI by Vertical
- SEO ROI by vertical: Medical Device 1,183%, Higher Education 994%, Oil & Gas 906%, B2B SaaS 702%, E-commerce 317% – with breakeven periods of 7–13 months across these verticals (60)
What This Reveals
Every vertical has its own version of the search funnel. In e-commerce, the battle is between search engines and marketplaces – and marketplaces are winning for product discovery among older demographics while social platforms take Gen Z. In B2B, the funnel is long and self-directed: buyers arrive informed, with research done and options already narrowed. In healthcare, online presence is binary – providers without one are invisible to a third of potential patients. In SaaS, with 42,000 competitors and rising acquisition costs, SEO is one of the few channels that compounds rather than resets at the end of each budget cycle.
SEO Jobs & Salaries Statistics
SEO Salaries
- Median across all SEO roles: $82,000 – above the US national average of $63,795 (3)
- VP of SEO averages $191,850 – approximately three times the US national average (3)
- Content SEO is the lowest-paid specialization at $67,500 average (3)
- 56% of $250K–$300K job descriptions mention AI skills, vs. 29% in the $100K–$150K range (3)
- Demand for AI skills in SEO job postings grew every quarter in 2024 – from 16% of listings in Q1 to 21% by Q4 (3)
- Skills commanding higher salaries in 2024: Technical SEO, Data Analytics, AI, and Stakeholder Management (3)
- Roles above $300K do not specifically list AI as a required skill (3)
- Link-building is mentioned most in sub-$100K job descriptions (3)
- 65% of SEO roles require no formal degree; 33% require a bachelor's; 2% require a graduate degree (3)
SEO Job Market
- Top roles by volume: Specialist, Manager, Analyst, Strategist (3)
- Seniority split: Mid-Level 59%, Senior 27%, Junior 14% (3)
- Employment type: In-House 65%, Agency 35% (3)
- Work environment: On-site 45%, Remote 34%, Hybrid 21% (3)
- Content SEO roles fell 28% in 2024; SEO Manager postings rose 58%; VP of SEO postings rose 50% in H2 2024 (3)
We studied the 2025 State of SEO Jobs Report by Previsible, which analyzed ~10,000 SEO job postings from 2024. Tyson Stockton, COO and co-founder, frames what the data reveals about where the profession is heading:
"SEO professionals have always been adaptable. We thrive in fast-changing environments. With LLMs and AI reshaping digital strategies, our expertise is more valuable than ever."
– Tyson Stockton, COO, Previsible (3)
- Fastest-rising skills in job postings: UI, UX, and Link-Building (3)
- 90% of open SEO positions are at firms with 250+ employees (3)
- Senior roles are concentrated at firms with 1,000+ employees (3)
- Junior roles are most prevalent in agency settings (3)
- Top hiring cities: NYC, Chicago, Atlanta, SF, Austin, Boston, LA, Dallas (3)
- Top hiring states: CA, NY, TX, IL, FL; trending upward: NC and PA (3)
What This Reveals
SEO is maturing into a management discipline. Demand is shifting toward strategy and leadership roles as junior content positions decline, and the salary premium for AI fluency at senior levels signals where the field is heading. Most SEO roles sit inside larger organizations, require no formal degree, and pay above the national average, making this one of the more accessible high-earning career paths in digital marketing.
SEO Trends for 2026
1. AI Answers Are Rewriting the Organic Playbook
Nearly eight in ten SEO professionals fear that AI-generated answers will reduce website clicks – and the SERP data backs that concern. (1) As AI Overviews expand across more query types, the traditional path from search to click is no longer guaranteed. Close to six in ten practitioners cite algorithm volatility and SERP disruptions as their greatest challenge, with AI Overviews specifically cutting into organic click volume. (1) Google's own SERP real estate is being restructured around generated answers, leaving organic results further down the page or out of the frame entirely.
The displacement hits TOFU content hardest. The evergreen explainer pages, "what is" posts, and broad awareness content that once served as the main entry point to websites are now being answered directly by AI without a click. (4) Traffic diversification – building presence where AI cannot fully intercept the conversation – is no longer optional. But the deeper question isn't just how to protect clicks. It's whether ranking, as a proxy for visibility, still means what it used to.
"If you are a publisher and dependent on click volumes, then your business model is being dismantled. Much like when 'new media' destroyed print publications, publishers are now in the process of navigating the demise of the click economy."
– Shelley Walsh, Managing Editor, Search Engine Journal (4)
2. Recognition Is the New Ranking
For nearly two decades, the SEO mandate was clear: get to the top of the organic search engine results pages. Position 1 meant visibility, traffic followed, and the logic was self-reinforcing. The entire industry – its tools, its talent, its measurement frameworks – was built around that premise. That premise is now breaking down.
The mechanism behind the breakdown is not another core update. The search landscape has changed more in the past 18 months than in the previous 10 years combined – AI Overviews absorbing clicks, LLM platforms becoming the first stop for research, and zero-click becoming the default. (83) AI and LLM systems do not crawl the SERP and surface the top result. They build their answers from training data, citation patterns, and entity relationships – drawing on which brands appear in industry publications, analyst commentary, review platforms, and expert content across the broader web. A brand that has invested exclusively in rankings can dominate Page 1 and still be invisible in every AI-generated response about its category. (83)
Recognition – being known, cited, and trusted outside your own domain – has three components that are now as strategically important as any technical SEO factor. Brand awareness across the web means your name appears in the right contexts beyond your site. Topical authority means the people and publications who shape opinion in your space associate your brand with the subjects you want to own. Entity clarity means every platform, knowledge graph, and AI system describing your brand arrives at the same consistent answer about what you do and who you serve. (83) The brands getting cited in AI Overviews and LLM responses are not always the ones that rank – they are the ones that have built the broadest recognition signal across the web.
"Rankings fluctuate with every algorithm update, and the value of a No. 1 ranking is seemingly shrinking with every update due to the continued and increasing number of SERP features and AI/LLM integrations. Recognition, though, once established, is much harder to displace."
– Search Engine Land (83)
3. The Hybrid Model: Human Expertise, AI Speed
The industry has reached a clear verdict on automation: augment, don't replace. Nearly six in ten SEO teams plan to focus on human-authored content supported by AI tools, while roughly one in four – about 22% – are pursuing full AI automation. (1) This isn't technophobia – it's strategic. Teams leaning hardest into AI are doing so at the workflow level: audits, keyword clustering, content briefs, first drafts. The human layer handles what comes next – editorial judgment, quality control, and the first-hand expertise that makes AI-generated output credible and defensible.
This shift is showing up in hiring and training budgets. Four in ten organizations are actively training their teams to integrate AI into SEO workflows, making it the leading structural change heading into 2026. (1) The value of an SEO practitioner is no longer measured by how many tasks they can perform, but by how well they can direct and edit AI-generated outputs toward a strategic goal.
"AI will take over the busywork – audits, keyword research, even content drafting – freeing SEOs to think bigger. Success will hinge on creating genuinely expert, distinctive assets that machines can't fake."
– Jono Alderson, Independent Technical SEO Consultant (1)
"AI is not going to take your job. The person who uses AI is going to take your job."
– Jensen Huang, Founder, President & CEO, Nvidia (6)
4. E-E-A-T Has Moved From Best Practice to Competitive Baseline
The AI slop era accelerated a quality reckoning that Google had been attempting for years. Between 2022 and 2024, the algorithm struggled to consistently surface helpful content over spam. (4) Now, with AI flooding the web with undifferentiated text, the practical value of experience, expertise, authoritativeness, and trustworthiness signals has risen sharply. Nearly half of SEO professionals are specifically planning E-E-A-T investments in the year ahead, making it the top strategic response to algorithm uncertainty. (1)
Two-thirds of practitioners identify original content creation as their most impactful SEO activity – a striking majority given how many tactical options exist. (1) What the data reflects is a market correction: the content shortcuts that worked in the link-volume era and the low-quality AI-generation wave are both running out of runway. The teams winning now are those producing content that carries a credible human voice, verifiable expertise, and genuine usefulness that an AI chatbot cannot replicate on demand.
"Right now, what is working for me is to find opportunities that are not being cannibalized by AIOs, and producing content that cannot be replicated by an LLM." – Shelley Walsh, Managing Editor, Search Engine Journal (4)
5. Niche Depth Outperforms Broad Scale
E-E-A-T answers the question of who is producing the content. Niche depth answers a different question: who is it actually for. The era of high-volume, broad-topic publishing built to capture as much keyword surface area as possible is giving way to something more deliberate – deep service to a specific, defined reader. The distinction matters because AI can now replicate generic expertise at scale. What it cannot replicate is intimate knowledge of a particular audience's real problems. (4)
The underlying logic is straightforward. When AI handles the generic answer, generic content has nothing left to offer a visitor that they couldn't get from a chatbot. The content that earns clicks, engagement, and return visits is the content that brings a perspective, a community, or a level of specificity that a large language model trained on internet averages cannot produce. Scale is no longer the goal; resonance is. (4)
"Refine your content strategy to exquisitely serve your ideal audience."
– Katie Morton, Editor-in-Chief, Search Engine Journal (4)
6. Diversify or Be Disrupted: The Case for Owned Channels
Serving a niche audience deeply solves the content problem. It doesn't solve the distribution problem. The most consistent strategic signal across expert commentary this year is that SEO teams should stop treating Google as the only channel through which that audience finds them. Not because Google is going away, but because over-reliance on any single traffic source creates fragility. Audience discovery is fracturing across platforms – social, video, podcasts, AI chat interfaces, newsletters – and brand presence on those platforms increasingly shapes whether a brand appears in the consideration set at all. (4)
The practical response is a two-stage approach: use rented platforms for awareness and audience discovery, then convert engaged users to owned channels where the relationship is direct and durable. (4) Email lists, communities, and direct subscription models offer something search rankings cannot – an audience that chose to come back. Owned communities compound over time in a way that algorithmic reach does not: early members help recruit the next wave, reducing long-term dependence on any platform's distribution decisions. (4)
"Depending solely on search traffic and digital ads is increasingly risky. Explore new revenue streams like commerce, events, subscriptions, newsletters, premium content, licensing, and community monetization. Google is not your business model – it's just a channel."
– John Shehata, CEO and Founder, NewzDash (1)
7. SEO Moves Up the Business Stack
All six trends above change what SEO delivers – more targeted content, broader recognition, deeper audience relationships. The final shift is about how that value gets communicated inside an organization. The measurement conversation in SEO has matured: traffic and rankings remain the top-reported KPIs, but lead generation and revenue attribution are rising fast – and the gap between "SEO as a visibility tactic" and "SEO as a business growth function" is closing. (1) Brand visibility improvements, pipeline influence, and lifetime audience value are increasingly how SEO programs are being justified at the leadership level.
This shift is also reflected in what practitioners say they need most: better attribution, more stakeholder buy-in, and deeper integration with product and brand strategy. The SEO function that delivers the most value is not the team that ranks for the most keywords – it's the team that can map their work to revenue, inform product positioning, and shape how the brand is perceived across every touchpoint where a buyer does research. (4)
"Those that use AI to uncover deeper insights, map complex user journeys, integrate SEO with product and brand strategy, and inform content creation at scale will thrive."
– John Shehata, CEO and Founder, NewzDash (1)
What This Reveals
SEO in 2026 is not in crisis – but it is in transformation. The strategies that delivered results through volume, broad keyword coverage, and consistent algorithm behavior are giving way to something that demands more: genuine expertise, specific audience knowledge, and a program connected to real business outcomes. The practitioners and organizations pulling ahead are not those with the biggest content libraries or the most backlinks. They are the ones that understood the shift early, invested in capability over shortcuts, and built audience relationships that no algorithm change can take away.
Conclusion
Search in 2026 is not declining – it is bifurcating. Google still controls the channel, but the click economy is giving way to a citation economy, and the metrics that mattered in 2023 are no longer sufficient proxies for visibility. The data across every chapter points to the same conclusion: the brands best positioned for what comes next are not the ones with the biggest content libraries or the most backlinks. They are the ones that built genuine expertise, technical foundations, and audience relationships before the shift happened – and kept measuring what actually matters.
What to do next
- Build for AEO and SEO simultaneously. AEO is not a separate track – it is good SEO done right. Topical authority, entity clarity, and content that earns citations serve both.
- Fix technical foundations first. Core Web Vitals and crawlability compound across every page. Nothing else works as well on a broken foundation.
- Use AI to scale, human judgment to differentiate. Automate briefs, audits, and drafts. Keep first-party insight, editorial voice, and real expertise in human hands.
- Write for a specific reader, not a keyword. Generic content has a chatbot as a competitor now. Niche depth and audience specificity are the only durable moat.
- Build recognition beyond your own domain. Citations, mentions, and topical association across the broader web shape both AI visibility and long-term brand authority.
- Convert organic traffic into owned audiences. Email, community, and video are long-term insurance. Build them while search is still funding the distribution.
- Connect SEO to revenue before the next budget cycle. Teams that measure pipeline contribution protect budgets. Teams that report on traffic lose them.
Work with Foursets on Your 2026 SEO Plan
The data in this article is clear: 2026 SEO is more complex than 2024. AI Overviews have changed the click economy. Brand mentions now outweigh backlinks for AI citation. Most organizations do not have the in-house infrastructure to navigate all of it.
Foursets builds and migrates B2B sites to Webflow and runs full-stack SEO in-house – not as a freelancer, not as a generalist agency. We have migrated dozens of sites and seen first-hand where the technical gaps are, where the content gaps are, and where AI visibility breaks down.
{{post-cta}}
Frequently Asked Questions
Is SEO dead or evolving in 2026?
SEO is not dead, it is expanding. Google still handles 90%+ of global search referrals, and it remains the #1 traffic source – in a HubSpot survey, 26% of web professionals named Google Search their single biggest traffic driver, more than any other channel. What has changed is the endpoint: ranking in the blue links is now one of two goals; getting cited inside an AI Overview is the second. 65% of SEO specialists expect no reduction in investment over the next 12 months. Forrester's official position is that Answer Engine Optimization is "significantly, but not fundamentally, different from SEO" – and that SEO practitioners are best positioned to adapt.
What is the 80/20 rule for SEO?
In SEO, roughly 20% of activities drive 80% of measurable results. The SEJ survey confirms this: original content creation (66.3%), content updates (42.6%), and technical SEO enhancements (42.3%) account for the majority of measurable impact. The remaining activities – backlink outreach, structured data, internal linking – matter, but at a lower return per hour. The same pattern holds for traffic: in most programs, a small number of high-intent pages drive the majority of conversions.
What is considered a good SEO score?
"Good" depends on the metric. For organic CTR, HubSpot's 2025 benchmark is 13% average (median 8%). For Core Web Vitals, Google's official thresholds are: LCP ≤2.5 seconds, INP ≤200ms, CLS ≤0.1. For a position-1 ranking, the average CTR fell to 0.039 for informational keywords by December 2025. For monthly traffic, the median is 20,000 sessions; the highest-traffic verticals – Entertainment (31,247), Pharmaceutical (24,781), and E-commerce (24,572) – sit well above it. Use the vertical benchmark for your industry – not a generic "good score."
What are the 4 types of SEO?
The four core SEO types are: (1) On-page SEO – optimizing content, keywords, meta tags, and structure; (2) Off-page SEO – link building, brand mentions, digital PR; (3) Technical SEO – site speed, crawlability, Core Web Vitals, schema markup; (4) Local SEO – Google Business Profile, map pack visibility, local search queries. A 2024 survey found the most effective search strategy in 2025 is optimizing for search intent (21%), with on-page content optimization (20%) and keyword research (20%) close behind. In 2026, a fifth type is emerging: GEO (Generative Engine Optimization) – optimizing for AI citation.
What is a good SEO number?
Benchmarks vary by vertical. HubSpot's 2025 data shows a median of 20,000 monthly organic visitors for the average website. By industry: Entertainment 31,247, Pharmaceutical 24,781, E-commerce 24,572, B2B SaaS 21,410, Real Estate 11,733, Legal Services 11,704, Financial Services 8,921. If your organic sessions are materially below your vertical median, technical SEO or content depth is likely the constraint – not the channel itself.
What percent of website traffic comes from organic search in 2026?
There is no single clean percentage, but Google Search is the most-cited #1 traffic source: in a HubSpot survey of 336 web professionals, 26% named it their single biggest traffic driver, more than any other channel, while paid social and paid search were each named by 10%. More than 50% of online adults use search to research brands before purchasing. Organic traffic growth was reported by 43% of websites in 2024; 44% remained stable; only 14% experienced declines.
How big is the global SEO industry in 2026?
U.S. search advertising alone reached $114.2 billion in 2025. The global search advertising market generated $316.3 billion in revenue in 2024, with global search ad spend reaching $352 billion in 2025. U.S. ad spend on search is forecast to reach approximately $236 billion by 2030. The broader U.S. digital advertising market was $294.6 billion in 2025.
How does Google AI Mode affect organic rankings in 2026?
Google AI Mode is powered by a custom version of Gemini 2.0 and uses a query fan-out technique that issues multiple related concurrent searches across subtopics. For organic rankings, the key impact is CTR: position-1 CTR dropped from 0.076 in December 2023 to 0.039 by December 2025 for informational keywords – a 49% decline. Rankings themselves are not eliminated; click volumes per ranking are reduced. AI Overviews now reach 2 billion monthly users. For brands cited inside AI Overviews, the data shows a different story: Google reports that 90% of B2B buyers who encounter AI Overviews click through to cited sources.
How much should a company spend on SEO per month in 2026?
There is no universal benchmark, spend scales with company size, vertical, and whether SEO is run in-house or via agency. What the data shows: 65% of professionals expect no reduction in SEO investment in the next 12 months. 56.6% maintained or increased SEO investment in the past year. The most budget-intensive activities are content creation (42.6% find it hardest to scale) and link acquisition (38.8%). Allocation should prioritize technical SEO first (highest leverage per dollar), content depth second, and AI visibility strategy third.
Will AI replace SEO professionals?
The data says no, and the labor market confirms it. The VP of SEO role grew 50% in posting frequency in H2 2024. SEO manager positions rose 58% while content SEO roles fell 28%. The median SEO salary is $82,000 – above the U.S. average. What AI replaces is the commodity layer: content drafting, basic audits, keyword research. What it cannot replace is strategic judgment, E-E-A-T authority, and the institutional knowledge that comes from running SEO programs over time.
References
- Search Engine Journal. The State of SEO 2026: How to Survive. https://www.searchenginejournal.com/state-of-seo/
- Datos. State of Search Q2 2025: Behaviors, Trends, and Clicks Across the US & Europe (A Semrush Company; clickstream data from tens of millions of active desktop users in US/EU/UK, April 2024–June 2025). https://datos.live/report/state-of-search-q2-2025/
- Previsible. 2025 State of SEO Jobs Report (Tyson Stockton, COO & Co-Founder). https://previsible.io/wp-content/uploads/2025/03/2025-previsible-state-of-seo-jobs-report.pdf
- Search Engine Journal. SEO Trends 2026. https://www.searchenginejournal.com/seo-trends/
- Search Engine Journal. The Future of AI Search. https://www.searchenginejournal.com/ai-search-future/
- Search Engine Journal. SEO In The Age Of AI. https://www.searchenginejournal.com/seo-in-the-age-of-ai/
- Briskon. Top 10 Enterprise SEO Trends for 2025 – citing KPMG (Briskon Technologies Pvt. Ltd., 2025 whitepaper). https://www.briskon.com/whitepaper/top-10-enterprise-seo-trends-for-2025/
- Usmany P. et al.. The Effectiveness of Search Engine Optimization (SEO) in Marketing: A Meta-Analysis Study (COSTING: Journal of Economic, Business and Accounting, 7(5), 2024, pp. 807–811). https://www.researchgate.net/publication/382953524_The_Effectiveness_Of_Search_Engine_Optimization_SEO_In_Marketing_A_Meta-Anlysis_Study
- Backlinko. "Google's 200 Ranking Factors: The Complete List" (Brian Dean, updated May 15, 2025). https://backlinko.com/google-ranking-factors
- Ahrefs. "Update: AI Overviews Reduce Clicks by 58%" (Ryan Law, Xibeijia Guan, February 4, 2026). https://ahrefs.com/blog/ai-overviews-reduce-clicks-update/
- IAB / PwC. "Internet Advertising Revenue Report: Full Year 2025". https://www.iab.com/news/digital-ad-revenue-climbs-to-nearly-300b-as-iab-celebrates-30-year-anniversary/
- IAB. "2026 Outlook Study". https://www.iab.com/news/outlook-study-forecasts-9-5-growth-in-u-s-ad-spend/
- Semrush. "We Studied 200,000 AI Overviews: Here's What We Learned" (2025). https://www.semrush.com/blog/ai-overviews-study/
- Semrush. "We Studied the Impact of AI Search on SEO Traffic" (2025). https://www.semrush.com/blog/ai-search-seo-traffic-study/
- BrightEdge. "One Year Into AI Overviews: Google Search Usage +49%" (press release, May 2025). https://www.brightedge.com/news/press-releases/one-year-google-ai-overviews-brightedge-data-reveals-google-search-usage
- BrightEdge. "AI Overview Citations Now 54% from Organic Rankings" (weekly AI search insights, September 2025). https://www.brightedge.com/resources/weekly-ai-search-insights/rank-overlap-after-16-months-of-aio
- DataReportal / Kepios / We Are Social. "Digital 2025 July Global Statshot" (July 2025). https://datareportal.com/reports/digital-2025-july-global-statshot
- DataReportal / Kepios / We Are Social. "Digital 2026: Global Overview Report" (2026). https://datareportal.com/reports/digital-2026-global-overview-report
- HubSpot. "2025 Web Trends Report + Website Traffic by Industry" (2025). https://blog.hubspot.com/website/web-traffic-analytics-report
- Ahrefs. "90+ AI SEO Statistics for 2025 (Fresh and Original Data)" (2025). https://ahrefs.com/blog/ai-seo-statistics/
- web.dev (Google). "Web Vitals" (2025). https://web.dev/articles/vitals
- Semrush. "26 AI SEO Statistics for 2026 + Insights" (2026). https://www.semrush.com/blog/ai-seo-statistics/
- Google. "Expanding AI Overviews and introducing AI Mode" (blog.google, March 2025). https://blog.google/products-and-platforms/products/search/ai-mode-search/
- BrightEdge. "Google Triggers 100% More AI Overviews for Longer Queries" (press release, 2025). https://www.brightedge.com/news/press-releases/google-triggers-100-more-ai-overviews-longer-queries-new-report-brightedge-finds
- DataReportal / Kepios / We Are Social. "Digital 2025 April Global Statshot" (April 2025). https://datareportal.com/reports/digital-2025-april-global-statshot
- Statista. "Online search market worldwide – statistics & facts" (topic page, 2025). https://www.statista.com/topics/1710/search-engine-usage/
- Statista. "Google – statistics & facts" (topic page, 2025). https://www.statista.com/stats/google/
- Statista Research Department. "Referral share of search engines worldwide 2015–2026" (published May 15, 2026). https://www.statista.com/statistics/1381664/worldwide-all-devices-market-share-of-search-engines/
- Statista Research Department. "Google: desktop search market share in selected countries 2025" (published Nov 19, 2025). https://www.statista.com/statistics/220534/googles-share-of-search-market-in-selected-countries/
- Statista / StatCounter. "Search engine market share of Bing in the United States, January 2018–April 2025" (released May 2025). https://www.statista.com/statistics/1383614/bing-search-engine-market-share-united-states/
- Statista. "AI-powered online search – statistics & facts" (topic page, 2025–2026). https://www.statista.com/topics/10825/ai-powered-online-search/
- Statista (Christy Tila). "Monthly active users of ChatGPT worldwide 2025" (published Apr 9, 2026). https://www.statista.com/statistics/1659718/global-monthly-chatgpt-users/
- Statista Research Department. "Self-reported ChatGPT use worldwide quarterly 2024–2025" (published Apr 29, 2026). https://www.statista.com/statistics/1384324/chat-gpt-demographic-usage/
- Statista Research Department. "U.S. adults using generative AI as primary tool for online search 2024–2028" (published Nov 28, 2025). https://www.statista.com/statistics/1454204/united-states-generative-ai-primary-usage-online-search/
- Statista Research Department. "U.S. AI summaries usage for most searches 2025, by generation" (published Nov 28, 2025). https://www.statista.com/statistics/1614042/usa-ai-summaries-usage-online-search-generation/
- Statista Research Department. "Google search queries with zero clicks Q1 2025" (published Nov 28, 2025). https://www.statista.com/statistics/1620329/google-search-queries-with-zero-clicks/
- Statista Research Department. "ChatGPT and Gemini monthly app downloads U.S. 2026" (published Mar 17, 2026). https://www.statista.com/statistics/1454331/united-states-chatgpt-gemini-app-downloads/
- Statista (Christy Tila). "Leading AI applications worldwide 2026, by MAU" (published May 11, 2026). https://www.statista.com/statistics/1609163/top-ai-applications-mau-worldwide/
- Statista (Thuy D.). "Share of mobile web traffic worldwide quarterly 2015–2026" (published Apr 28, 2026). https://www.statista.com/statistics/277125/share-of-website-traffic-coming-from-mobile-devices/
- Statista / StatCounter. "Share of mobile device website traffic worldwide since 2010". https://www.statista.com/chart/35951/share-of-mobile-device-website-traffic-worldwide-since-2010/
- Statista Research Department. "Leading channels for product search worldwide 2025" (published Nov 28, 2025). https://www.statista.com/statistics/1034209/global-product-search-online-sources/
- Statista. "Most visited online retail websites worldwide by monthly traffic, August 2025". https://www.statista.com/statistics/274708/online-retail-and-auction-ranked-by-worldwide-audiences/
- Statista. "Focus areas of SEO professionals worldwide 2024". https://www.statista.com/statistics/1402871/focus-areas-seo-worldwide/
- Statista. "Metrics used to measure SEO performance worldwide 2024". https://www.statista.com/statistics/1402867/metrics-seo-worldwide/
- Statista / StatCounter. "Market share of leading search engines in the United States, April 2025". https://www.statista.com/statistics/1385902/market-share-leading-search-engines-usa/
- Statista / StatCounter. "Market share of mobile search engines in the United States, April 2025". https://www.statista.com/statistics/511358/market-share-mobile-search-usa/
- Statista Research Department. "U.S. platforms used for online shopping inspiration or research 2024, by age group" (published Apr 28, 2026). https://www.statista.com/statistics/1461958/usa-platforms-used-for-shopping-inspiration-or-research-by-age-group/
- Statista Research Department. "AI-powered search usage among U.S. adults 2024, by search type" (published Nov 28, 2025). https://www.statista.com/statistics/1610076/united-states-adults-ai-powered-search-types/
- Statista Research Department. "Google search engine global mobile market share 2015–2025" (published Nov 28, 2025). https://www.statista.com/statistics/1358039/worldwide-mobile-market-share-of-search-engine/
- Statista Research Department. "Google – statistics & facts" (topic page, 2025–2026). https://www.statista.com/topics/1001/google/
- Statista Research Department. "Google market share of mobile search in the UK 2017–2025" (published Nov 28, 2025). https://www.statista.com/statistics/280275/market-share-held-by-google-search-engines-in-the-united-kingdom-uk/
- Search Engine Journal. "The Complete Guide to SEO: Meet the Search Engines". https://www.searchenginejournal.com/seo/meet-search-engines/
- SQ Magazine. "Google Search Statistics". https://sqmagazine.co.uk/google-search-statistics/
- Statista. "Online search behaviors – statistics & facts". https://www.statista.com/topics/13036/online-search-behaviors/
- Statista. "Customer satisfaction with internet portals and search engines in the U.S. 2000–2024". https://www.statista.com/statistics/312770/us-customer-satisfaction-with-online-portals-and-search/
- Statista. "Online channels used to start product search worldwide Q2 2023". https://www.statista.com/statistics/1417439/onlines-channels-source-product-search-worldwide/
- Statista. "Most popular search topics among Gen Z adults in the U.S. by platform, April 2024". https://www.statista.com/statistics/1496774/us-gen-z-most-search-topics-on-selected-platforms/
- Gartner. cited in Bruce Clay, "How to justify your SEO budget in 2025" (Search Engine Land, July 23, 2025). https://searchengineland.com/justify-seo-budget-459284
- Statista. "Impact of SEO on marketing worldwide 2022" (J. G. Navarro, published Nov 28, 2025). https://www.statista.com/statistics/248052/impact-seo-marketing-worldwide/
- Backlinko. "SEO Services Statistics". https://backlinko.com/seo-services-statistics
- Search Engine Land. "Don't kill your SEO budget, shift it" (2025). https://searchengineland.com/dont-kill-your-seo-budget-shift-it-459025
- Search Engine Land. "Google: 5 trillion searches per year" (Danny Sullivan, 2025). https://searchengineland.com/google-5-trillion-searches-per-year-452928
- Search Engine Land. Dale Bertrand, "Why traditional keyword research is failing and how to fix it with search intent" (February 14, 2025). https://searchengineland.com/fix-traditional-keyword-research-search-intent-451880
- Ahrefs. "SEO Statistics". https://ahrefs.com/blog/seo-statistics/#keyword-statistics
- Backlinko. "We Analyzed 11.8 Million Google Search Results. Here's What We Learned About SEO" (Brian Dean). https://backlinko.com/search-engine-ranking
- Backlinko. "We Analyzed 912 Million Blog Posts. Here's What We Learned About Content Marketing" (Brian Dean, February 19, 2019). https://backlinko.com/content-study
- Ahrefs. "96.55% of Pages Get No Organic Traffic From Google. Here's How to Be in the Other 3.45%" (December 1, 2023). https://ahrefs.com/blog/search-traffic-study/
- Authoritas study. cited in Jeremy Moser, "How to choose a link building agency in the AI SEO era" (Search Engine Land, January 13, 2026). https://searchengineland.com/how-to-choose-a-link-building-agency-in-the-ai-seo-era-467238
- HTTP Archive. Web Almanac 2025, Chapter 5: SEO (Amaka Chukwuma, Chris Green, Sophie Brannon; published January 15, 2026). https://almanac.httparchive.org/en/2025/seo
- Google/Soasta research study. cited in Search Engine Land, "Advanced technical SEO tips". https://searchengineland.com/guide/advanced-technical-seo-tips
- Search Engine Land. "Mastering voice search SEO: Simple strategies that work" (Tanatswa Chingwe, last updated November 27, 2025). https://searchengineland.com/guide/voice-search
- DataReportal. Global Digital Overview 2025 – cited in Backlinko, "Voice Search Statistics". https://backlinko.com/voice-search-stats
- BrightLocal. cited in WebFX, "Voice Search & Digital Marketing". https://www.webfx.com/blog/seo/seo-trends/
- Backlinko. "YouTube Users and Stats" (October 2025). https://backlinko.com/youtube-users
- Wyzowl. "State of Video Marketing 2026". https://wyzowl.com/video-marketing-statistics/
- Search Engine Roundtable / SOCi. cited in Backlinko, "Local SEO Stats". https://backlinko.com/local-seo-stats
- BrightLocal. "Local Consumer Review Survey 2026". https://brightlocal.com/research/local-consumer-review-survey/
- HubSpot. "State of Sales Report 2025". https://blog.hubspot.com/sales/sales-statistics
- HubSpot. "State of Marketing Report 2026". https://www.hubspot.com/state-of-marketing
- Backlinko. "SaaS Statistics" (citing Latka / BetterCloud / Sapphire Ventures). https://backlinko.com/saas-statistics
- SE Ranking. "SEO for Healthcare" (citing Kyruus Health 2022 / Harmony Hit). https://seranking.com/blog/seo-for-healthcare/
- Semrush. "SaaS Statistics" (citing Statista 2024 / Grand View Research 2023). https://www.semrush.com/blog/saas-statistics/
- Search Engine Land. "SEO's new goal: Recognition" (2026). https://searchengineland.com/seo-goal-recognition-476756
- Statista / StatCounter. "Search engine market share of DuckDuckGo, July 2019–January 2025, by region" (released January 2025). https://www.statista.com/statistics/1220046/duckduckgo-search-engine-market-share-worldwide-by-region/
- Google Search Central. "AI Optimization Guide" (2025). https://developers.google.com/search/docs/fundamentals/ai-optimization-guide
- First Page Sage. Organic Traffic Benchmarks by Industry (2022). https://firstpagesage.com/reports/organic-traffic-benchmarks-by-industry/







.avif)