Web design is no longer just a branding exercise. It influences how customers discover businesses, evaluate credibility, and convert online. At the same time, the industry itself is changing rapidly, with AI tools, no-code platforms, evolving search behavior, accessibility requirements, and growing competition all reshaping how websites are built.
To separate trends from assumptions, we analyzed the latest web design statistics from industry reports, research firms, and leading web platforms, drawing on authoritative sources such as Statcounter, Statista, McKinsey, Adobe, W3Techs, Figma, Nielsen Norman Group, and more. This collection covers the size and growth of the web design market, what websites cost to build, the return on good design, mobile and responsive design, the rise of AI, and the web design job market.
Whether you're planning a redesign, hiring a web design agency, or simply benchmarking your website against current industry standards, these statistics provide a data-backed view of where web design stands in 2026.
Top Web Design Statistics
Short on time? These are the standout web design statistics for 2026, with the full breakdown in the sections that follow.
For 91% of teams, the website now drives more revenue than any other marketing channel. (Webflow)
Design pays off: the firms McKinsey rated highest for design outgrew their peers by 32 percentage points in revenue and 56 in total shareholder returns over five years, roughly twice the annual rate (about 10% revenue growth a year versus 3-6%). (McKinsey)
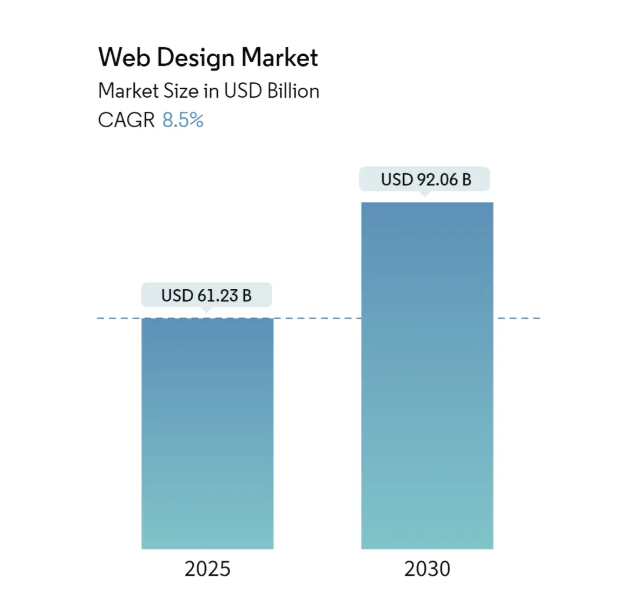
The global web design market is on track to grow from $61.2 billion in 2025 to roughly $92 billion by 2030, an 8.5% annual clip. (Mordor Intelligence)
WordPress still runs 41.5% of all websites and holds a 59.3% share of the CMS market. (W3Techs)
A typical web design project averages $38,105 and runs around 7 months, though most cost under $10,000. (Clutch)
Mobile now generates over half of all web traffic worldwide (50.29%). (Statcounter)
Yet mobile still converts 45% lower than desktop, the central challenge of mobile design. (Deloitte and Google)
90% of websites are now responsive, adapting to whatever screen they load on. (Clutch)
Users form a first impression of a website in about 50 milliseconds, and 83% of consumers judge its credibility in under 20 seconds. (Nielsen Norman Group, Clutch)
Accessibility is still broken across most of the web: 95.9% of home pages have detectable WCAG failures. (WebAIM)
AI is now standard practice: 93% of web designers use AI tools in their workflow. (Clutch)
By 2026, generative AI is expected to reshape 70% of the design and development effort for new web apps. (Clutch)
Talent is scarce: 95% of tech leaders struggle to hire skilled designers and developers. (Clutch)
Web Design Industry Statistics
The web design market is large, still growing, and consolidating around a handful of platforms. One caveat before the numbers: different research firms track different slices of this space, so the totals below are not directly comparable. Web design services, the broader web development market, and website builder software each use their own scope and methodology.
The global web design market is projected to reach roughly $92 billion by 2030, up from $61.2 billion in 2025, reflecting steady annual growth of 8.5%. (Mordor Intelligence)
Figure 1. Global web design market size and forecast, 2025 to 2030 (USD billions). Source: Mordor Intelligence.
Measured independently by IBISWorld, the US web design services market alone is worth $47.4 billion in 2025 and has grown at a 2.3% CAGR since 2020. Because it uses a different scope than the global estimate above, the two figures are not directly comparable. (IBISWorld)
The broader web development market, which includes far more than design, is projected to reach $142 billion by 2033, a 9.2% CAGR from 2025 to 2033. (Web Professionals Global)
Europe's web design market is expected to reach $26 billion by 2035. (WiseGuy Reports)
Asia-Pacific is expected to be the fastest-growing regional web design market through 2030. (Mordor Intelligence)
The US web design industry includes about 203,000 businesses, and no single company controls more than 5% of the market. (IBISWorld)
Web design remains a highly fragmented market, with no dominant player and a long tail of providers competing from local to global scale. (Mordor Intelligence)
Custom web design is the industry's largest service segment, expected to grow from $20 billion in 2024 to $36 billion by 2035. (WiseGuy Reports)
Projected web design market value by service type, 2035:
Service type
Projected value (2035)
Custom Web Design
$36B
Template-based Web Design
$26B
E-commerce Web Design
$22B
Table 1. Projected web design market value by service type, 2035. Source: WiseGuy Reports.
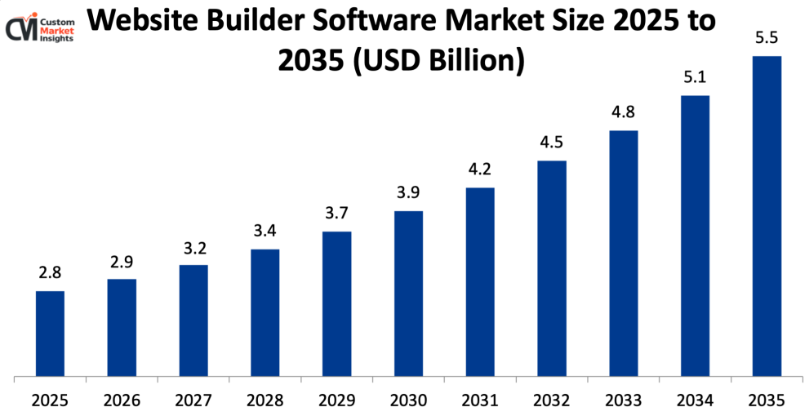
The global website builder software market is worth $2.8 billion in 2025 and is forecast to reach about $5.5 billion by 2035, growing at roughly 7% per year. (Custom Market Insights)
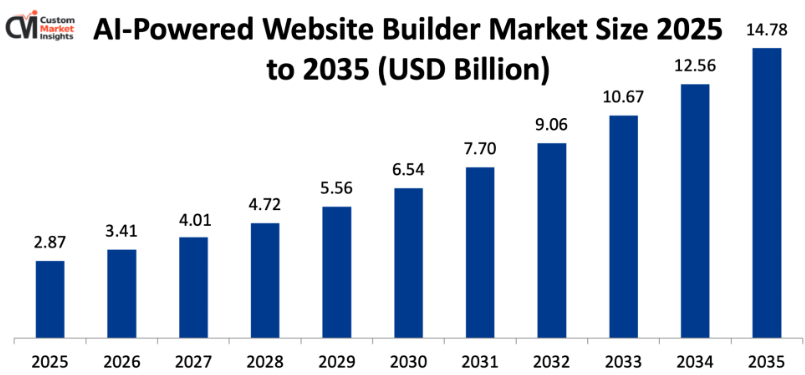
The AI website builder market is growing far faster: from $2.87 billion in 2025 to $3.41 billion in 2026, with a projected $14.78 billion by 2035 (a 17.7% CAGR). (Custom Market Insights)
Figure 3. AI website builder market size, 2025 to 2035 (USD billions). Source: Custom Market Insights.
WordPress leads the website builder market with over 67% of it (more than two-thirds), followed by Wix at 13.3% and Squarespace at 8.4%. (Statista)
Looking across the entire web rather than just builders, WordPress powers 41.5% of all websites, giving it a 59.3% share of the CMS market as of June 2026. (W3Techs)
The top 10 content management systems by share of all websites, June 2026:
CMS
Share of all websites
WordPress
41.5%
Shopify
5.2%
Wix
4.3%
Squarespace
2.5%
Joomla
1.2%
Webflow
0.9%
Tilda
0.8%
Duda
0.7%
Drupal
0.7%
GoDaddy Website Builder
0.6%
Table 3. Top 10 CMS by share of all websites, June 2026. Source: W3Techs.
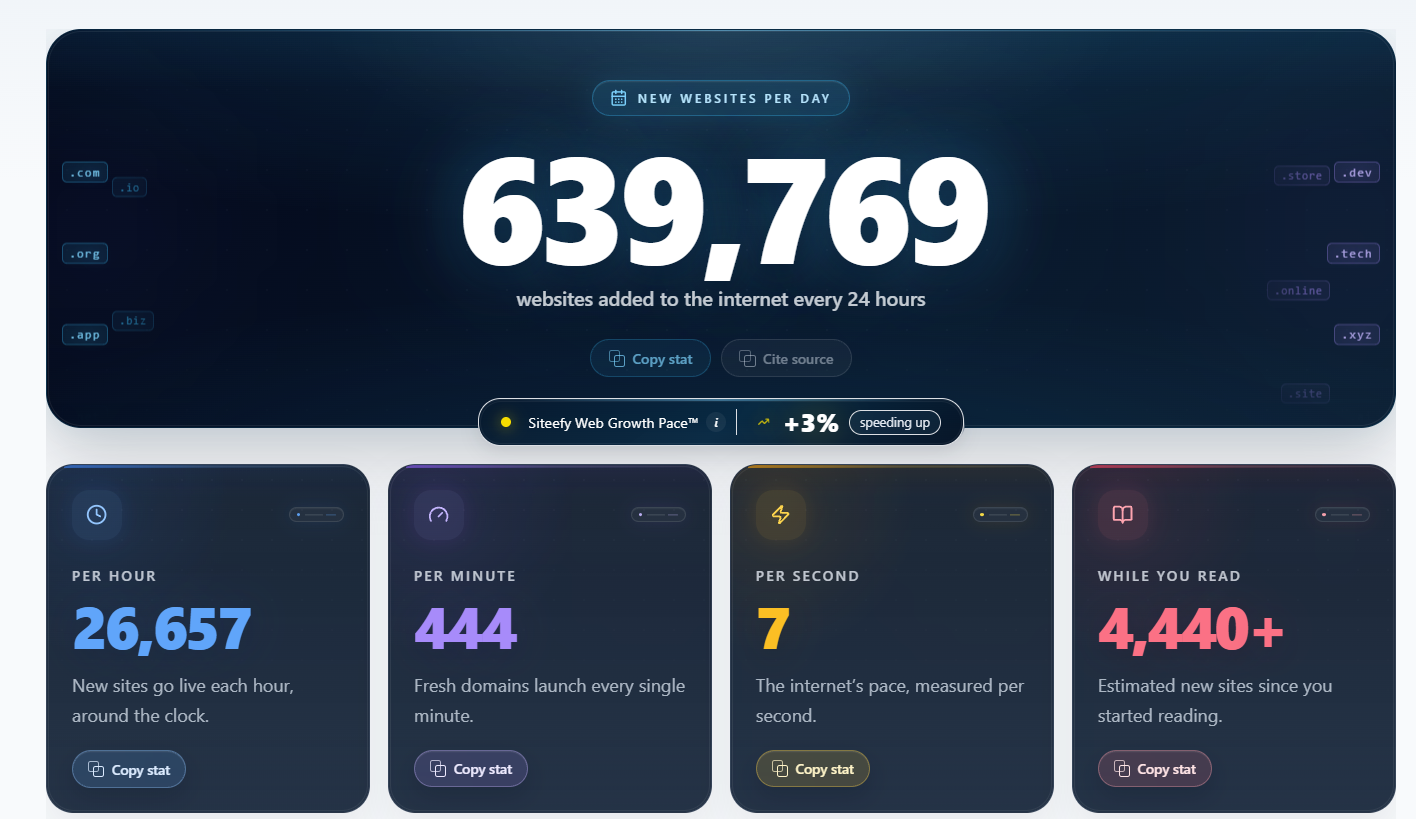
As of June 2026, 1,489,396,284 websites now exist online globally, with around 639,769 new sites launched every day. (Siteefy)
Figure 4. New websites added to the internet, per day, hour, minute, and second, June 2026. Source: Siteefy.
Mobile devices generate more than half of global web traffic, at 50.29% as of May 2026, making responsive design a baseline requirement for modern websites. (Statcounter)
83% of small businesses now have a website, up from 64% in 2018, driven in part by the rise of affordable no-code tools and AI integrations. (Clutch)
12% of small businesses launched a website in the past year alone. (Clutch)
17% of small businesses still have no website, and 84% of them cite reasons other than cost, with 34% believing a website is not relevant to their industry. (Clutch)
US holiday-season ecommerce spending reached a record $257.8 billion in 2025, up 6.8% year over year, reinforcing demand for high-performing ecommerce websites. (Adobe)
The web design industry continues to grow, but growth is uneven across segments. Platforms are increasingly concentrated around WordPress, Wix, and Squarespace, while service providers remain highly fragmented. For businesses, that means platform choice is relatively straightforward, but choosing the right design partner remains the more important decision.
Web Design Costs Statistics
Web design pricing spans from standalone design work to full design-led projects, so quoted figures range from a few hundred dollars for a template to tens of thousands for an agency build. It refers mainly to visual design, layout and UX/UI work; development, hosting, search engine optimization (SEO), and ongoing website maintenance are usually billed on top. Read the figures below as market ranges, not fixed quotes.
Web design agencies typically charge $2,000 to $100,000 per project. (Clutch)
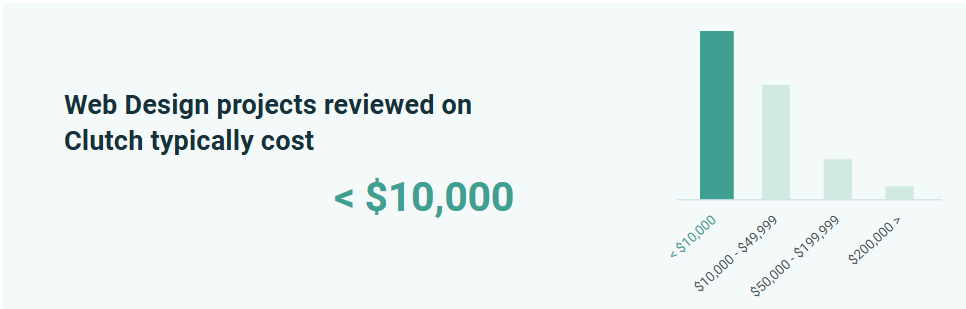
The average web design project costs $38,105 and runs around 7 months, at roughly $5,280 per month. (Clutch)
That average is not the typical price: most web design projects reviewed on Clutch cost less than $10,000, and a small number of large projects pull the average up. (Clutch)
Figure 5. Web design project cost distribution on Clutch, by price band. Source: Clutch.
GoodFirms' 2026 survey of 300+ web firms across 31 countries confirms that, pricing fixed-price web projects at $1,000 to $150,000+, with most agencies (63%) quoting between $1,000 and $15,000. (GoodFirms)
In the same GoodFirms survey, 71% of agencies deliver basic websites and MVPs in under four weeks. (GoodFirms)
DIY website design ranges from $0 to $500 per month, depending on the platform and plan (e.g., Wix, Squarespace, WordPress), with lower costs achieved through template-based tools. (WebFX)
Web design templates cost $20 to $300+ per template on average, with higher-priced templates offering more customization, support, and responsive layouts. (WebFX)
Custom graphics (logos, icons, illustrations, motion design) cost $500 to $1,500 per asset on average, depending on complexity and design requirements. (WebFX)
Ecommerce functionality ranges from $3,000 to $10,000 for small stores, and $40,000 to $100,000+ for large-scale ecommerce platforms with advanced functionality. (WebFX)
Interactive features (such as calculators, quizzes, polls, and tools) cost between $1,000 and $20,000, depending on complexity and number of pages involved. (WebFX)
Page design, from landing pages to full multi-page sites, can range from $1,000 to $10,000 for up to 250 pages. (WebFX)
Hourly, the rate depends on who does the work and where they are based.
Web design agencies charge $100 to $149 per hour, while work done on website-builder platforms runs $25 to $49 per hour. (Clutch)
Table 4. Web design hourly rates by region. Source: Clutch.
Beyond design and build, ongoing costs apply: hosting runs $2 to $1,000 per month, a domain $1 to $12 per year, and an SSL certificate $0 to $1,500 per year. (WebFX)
The takeaway is that web design cost tracks two things: how custom the work is, and who does it. A template runs a few hundred dollars, while a fully custom, design-led project from an agency reaches tens of thousands, so match the design investment to what the site actually has to achieve.
Web Design ROI Statistics
Good design is a revenue lever; a poorly designed website leaks it. Here is what the numbers say about the return on web design, from conversion to revenue.
The website is now the primary revenue channel for most businesses, and good design works harder to convert the website visitors you already paid for.
91% of teams say the website drives more revenue than any other marketing channel. (Webflow)
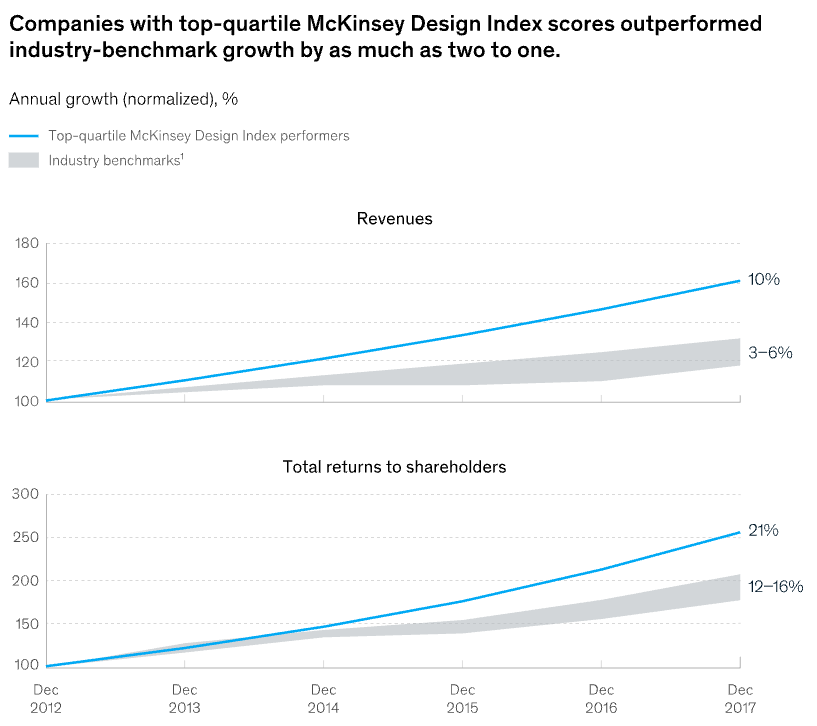
In a 2018 McKinsey study of 300 companies tracked over five years, each was scored on how seriously it treats design (its Design Index). The companies in the top quarter for design outgrew their industry peers by 32 percentage points in revenue and 56 percentage points in total shareholder returns over the period, roughly twice the annual rate. In annual terms, that is about 10% revenue growth versus 3-6% for peers, and 21% in shareholder returns versus 12-16%. (McKinsey)
Figure 6. Annual growth of top-quartile McKinsey Design Index performers vs industry benchmarks, revenues and total shareholder returns, 2012 to 2017 (normalized). Source: McKinsey.
Small businesses invest in a website mainly to increase sales and revenue (39%), build brand awareness and credibility (24%), or provide information and customer support (22%). (Clutch)
In a 2021 Clutch survey of 500 US consumers, 50% said a website's design is important to a company's brand, and 42% would leave a site because of poor functionality. (Clutch)
Every $1 invested in UX returns about $100, roughly a 100-to-1 return. (Clutch)
Consistent brand presentation drives a 10 to 20% revenue increase, according to a survey of more than 400 brand managers. (Marq)
The average large ecommerce site can lift its conversion rate by 35.26% through better checkout design. Roughly $260 billion in lost orders is recoverable through improved checkout flow and design. (Baymard)
A benchmark of 60 leading ecommerce sites found the average site has 39 areas for checkout improvement. (Baymard)
A 0.1 second improvement in mobile site speed lifted retail conversions by 8.4% (with average order value up 9.2%) and travel conversions by 10.1%, and improved lead-generation page bounce rates by 8.3%, across 37 brands and 30 million user sessions in Europe and the US, according to Deloitte and Google's Milliseconds Make Millions report.
75% of survey respondents say accessibility contributes to improved revenue. (Level Access)
71% of users with disabilities will leave a site that is not accessible, a lost opportunity among the 1.3 billion people who live with a disability. (Clutch)
4,605 web accessibility lawsuits were filed in US courts in 2023, up 42% year over year, making inaccessible design a legal and revenue risk. (Clutch)
Website ROI success stories
These are results from our own client work, where website redesign projects drove measurable business outcomes.
BD Emerson added 35% to annual revenue after a new website, Webflow build, and SEO, contributing an additional $480k in revenue in Q1 2024 at an ROI of over 9000% annually, with the redesign paying for itself within three months.
Setproduct saw a 300% increase in organic search traffic and a 30% lift in conversion to product sales after migrating off Tilda and rebuilding on Webflow.
Momentum Studios now converts roughly 35% of its website leads into clients after a new brand identity and Webflow site.
Bay Rag saw a 51% increase in organic traffic after a brand refresh and a custom B2B portal built on its existing Shopify.
Atticus saw a 26% increase in organic traffic after rebuilding its website.
The takeaway is that design is a measurable revenue lever, not a cosmetic cost. Sites that reduce friction and design for accessibility convert better and recover revenue that poor user experience quietly leaks away.
Mobile Web Design Statistics
Mobile is no longer a secondary screen. For most sites it is the primary one, and as mobile usage keeps climbing, designing for it is the default. Here is where mobile stands.
Mobile now drives about half of all website traffic worldwide, though desktop still leads in the US and Europe.
Region
Mobile
Desktop
Tablet
Worldwide
50.29%
48.24%
1.48%
United States
42.35%
55.45%
2.2%
Europe
44.11%
53.64%
2.25%
Table 5. Web traffic by platform, May 2026. Source: Statcounter.
People spend 70% of their internet time on mobile devices, and 74% of users are more likely to return to a site if it is mobile-friendly. (WebFX)
The most common mobile screen resolution worldwide is 414x896 (12.66%), followed by 360x800 (9.11%) and 390x844 (6.58%). (Statcounter)
By device vendor, Apple leads at 31.94%, followed by Samsung (18.83%), Xiaomi (8.84%), Oppo (5.65%), and Vivo (5.6%). (Statcounter)
5G reached 48% of mobile data traffic globally at the end of 2025, up from 34% a year earlier, and is projected to hit 85% by 2031. (Ericsson)
Google uses the mobile version of a site's content, crawled with the smartphone agent, for indexing and ranking, a practice called mobile-first indexing, so the mobile experience directly shapes search visibility. (Google)
Mobile drove 56.4% of online holiday-season transactions in 2025, up from 54.5% in 2024. (Adobe)
On Christmas Day 2025, mobile reached 66.5% of online sales, and on Thanksgiving Day 61.6%. (Adobe)
During Cyber Week 2025, mobile devices drove 70% of online orders both globally and in the US, and mobile wallets like Apple Pay made up 27% of global orders (29% in the US). (Salesforce)
Despite that traffic, retailers see 45% lower conversion rates on mobile than on desktop, which is the core mobile design problem. (Deloitte and Google)
The median mobile home page is 2.6 MB in 2025, growing 8.4% from 2.4 MB in 2024. (HTTP Archive)
The median mobile home page loads 632 KB of JavaScript and 911 KB of images. (HTTP Archive)
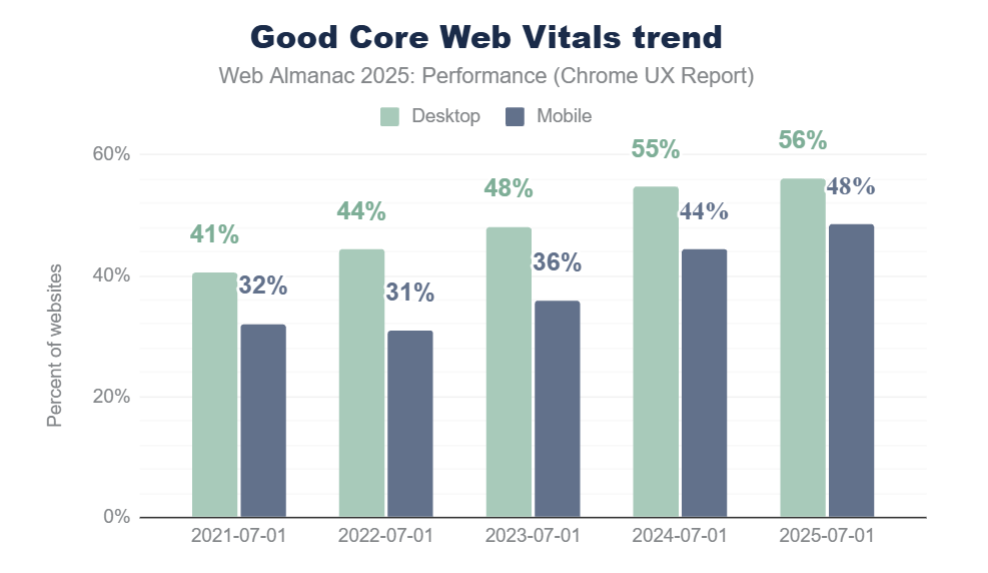
Only 48% of mobile websites achieve good Core Web Vitals, versus 56% on desktop; mobile trails on LCP (62% vs 74%) and INP (77% vs 97%) but leads on CLS (81% vs 72%). (HTTP Archive)
Figure 7. Share of websites with good Core Web Vitals, desktop vs mobile, 2021 to 2025. Source: HTTP Archive.
As mobile page load time goes from 1 second to 7 seconds, the probability of a visitor bouncing increases 113%. (Google)
Slow-loading mobile sites cost companies an estimated $2.6 billion a year in lost revenue, with about half of users leaving a page that takes 10 seconds to load. (Clutch)
Travel companies that adopted Progressive Web Apps saw a 3x jump in conversions and a 180% improvement in retention. (Clutch)
Frustration signals on mobile are rising, dragging down user engagement.
Mobile bounce rate rose 54% from 2024 to 2025, with half of all mobile users exiting after just one page. (FullStory)
Mobile error clicks surged 667% from 2024 to 2025. (FullStory)
The takeaway is that mobile traffic is no longer the challenge; mobile experience is. Users spend most of their online time on mobile devices, but slow pages, poor website usability, and technical issues continue to create friction. The biggest opportunity for many websites is improving the experience for the mobile visitors they already have.
Responsive Web Design Statistics
Responsive website design is no longer a nice-to-have feature, it is the standard. People browse the web on phones, tablets, laptops, ultrawide monitors, and everything in between, often switching between devices throughout the day. A website that fails to adapt to different screen sizes risks losing potential customers before they even engage with the content. The statistics below show why responsive design has become a core requirement of modern web design.
Device
Most common resolution
Share
Desktop
1920x1080
17.57%
Mobile
414x896
12.66%
Tablet
768x1024
9.09%
Table 6. Most common screen resolution by device, May 2026. Source: Statcounter.
90% of websites now use responsive design. (Clutch)
Google recommends responsive web design as its preferred mobile configuration, calling it the easiest design pattern to implement and maintain. (Google)
Mobile friendly websites see 11% higher conversion rates, and users engage 15% more with designs that respond fluidly to their screen size. (Clutch)
90% of B2B buyers expect websites to deliver consumer-grade digital experiences: intuitive design, mobile responsiveness, and personalized content. (Clutch)
Across browsers worldwide in May 2026, Chrome leads at 70.25%, followed by Safari (15.72%), Edge (5.14%), Firefox (2.19%), and Samsung Internet (1.89%). (Statcounter)
By operating system, Android (34.9%) and Windows (29.98%) lead, followed by iOS (16.81%) and OS X (5%). (Statcounter)
Responsive design extends beyond layouts. Typography, spacing, and visual elements must also adapt to different screen sizes to maintain a consistent user experience. 88% of websites use web fonts in 2025, up from about 87% in 2024. (HTTP Archive)
WOFF2 accounts for about 65% of font file requests on both desktop and mobile pages. (HTTP Archive)
39.4% of desktop websites and 41.3% of mobile websites used at least one variable font in 2025. (HTTP Archive)
The responsive web design segment is projected to be worth $12 billion in 2024. (WiseGuy Reports)
The takeaway is that responsive is the floor, not the ceiling. With no single dominant screen size, browser, or operating system, designing fluidly across the whole range is what keeps a site usable and visible everywhere its traffic comes from.
Web Design User Perception Statistics
First impressions matter more online than almost anywhere else: users judge a website in an instant, and much of that judgment comes down to design. These statistics show how fast people form an opinion, what earns their trust, and what makes them leave.
Users form a first impression of a website in about 50 milliseconds, and that aesthetic judgment rarely changes even when they are given more time. (Nielsen Norman Group)
83% of consumers judge a website's credibility in under 20 seconds: 28% almost immediately and 55% within 10 to 20 seconds, while only 13% wait until they have explored the site. (Clutch)
87% of consumers have left a website immediately because it did not look trustworthy, and 45% say a first impression alone shapes whether they engage further. (Clutch)
84% of consumers say a website's design influences whether they shop with a brand, 23% call design the top factor when judging trustworthiness, and 21% say design and layout are the biggest credibility indicator. (Clutch)
The first things users notice on a new site are its design and layout (30%), ease of navigation (19%), and imagery (13%). (Clutch)
Users spend about 80% of their viewing time on the left half of the page and 20% on the right, so key content and navigation belong on the left. (Nielsen Norman Group)
Users scan pages in an F-shaped pattern, on both desktop and mobile, rather than reading word by word. (Nielsen Norman Group)
Attention concentrates at the top of the page: users spend about 57% of their viewing time above the fold and 74% within the first two screenfuls, with attention dropping sharply further down. (Nielsen Norman Group)
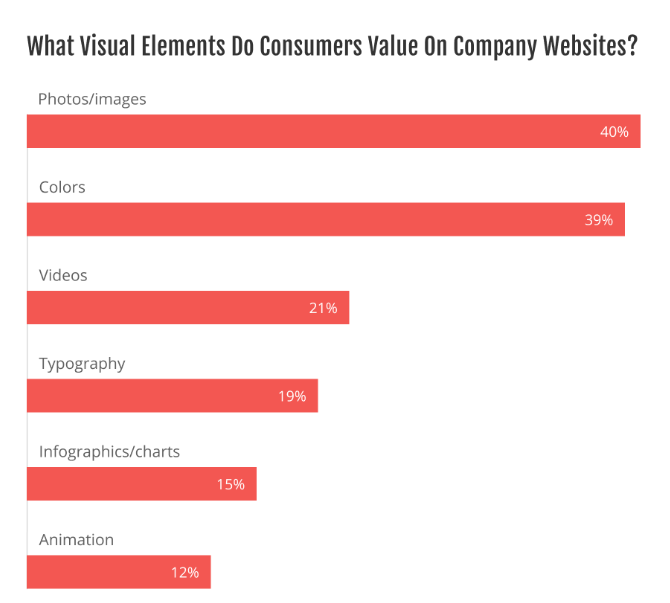
When asked what visual elements they value on company websites, consumers cite photos and images (40%), color (39%), and videos (21%), followed by typography (19%), infographics and charts (15%), and animation (12%). (Clutch)
Figure 8. Visual elements consumers value on company websites, 2021. Source: Clutch.
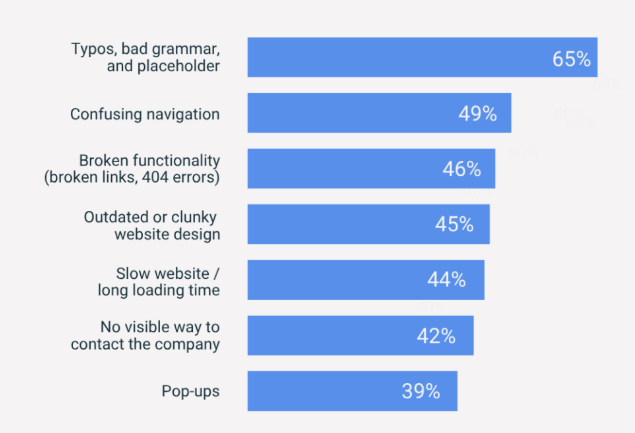
The fastest ways to lose a visitor's trust are typos and bad grammar (65%), confusing navigation (49%), broken functionality such as dead links and 404s (46%), outdated design (45%), slow loading (44%), no visible contact information (42%), and pop-ups (39%); 48% give a slow site 10 seconds or less before leaving. (Clutch)
The strongest signals that a site feels secure are the SSL lock icon in the address bar (33%), a clean professional design (23%), and recognizable security badges (14%), followed by two-factor authentication (11%), clear privacy standards and terms of service (8%), transparent data practices (5%), testimonials or reviews (4%), and an About Us page (2%). (Clutch)
Figure 9. What makes consumers feel a website is secure. Source: Clutch.
Among colors, consumers most prefer blue (46%) and green (30%) on business websites. (Clutch)
Dark mode is popular but not essential: about a third of mobile users keep their device in dark mode, a third in light mode, and a third switch between them, and users behave similarly with or without it. (Nielsen Norman Group)
The takeaway is that users decide in seconds and judge mostly on visuals. A clean, visually appealing, fast, error-free design is what earns the trust and the few seconds of attention a site needs before its content is ever read.
AI Web Design Statistics
AI has quickly moved from an emerging tool to a standard part of many web design workflows. Designers use it daily, businesses report real gains, and AI is starting to reshape how users find and judge websites, but customer trust has not caught up. Here is where AI stands in web design.
How designers and developers use AI
93% of web designers use AI tools in their workflows: 58% to generate original imagery, 51% for web page layouts, and 49% to test new creative strategies. (Clutch)
82% of developers use AI for writing or reviewing code, and 81% say it makes them more productive. (Clutch)
78% of professionals say AI tools significantly speed up their workflows, and 58% say it improves the quality of their work. (Figma)
85% of designers and developers say AI will be essential to their future success. (Figma)
56% of designers and developers say AI makes them feel more hopeful about where design is headed, though 40% do not yet trust AI-generated outputs enough to rely on them fully. (Figma)
55% of designers say their clients support the use of AI in design workflows. (Clutch)
Among Gen Z professionals, 87% believe human-AI collaboration represents the future of creativity, and 63% believe being encouraged to experiment with AI would improve their ability to communicate visually. (Canva)
What businesses are gaining from AI
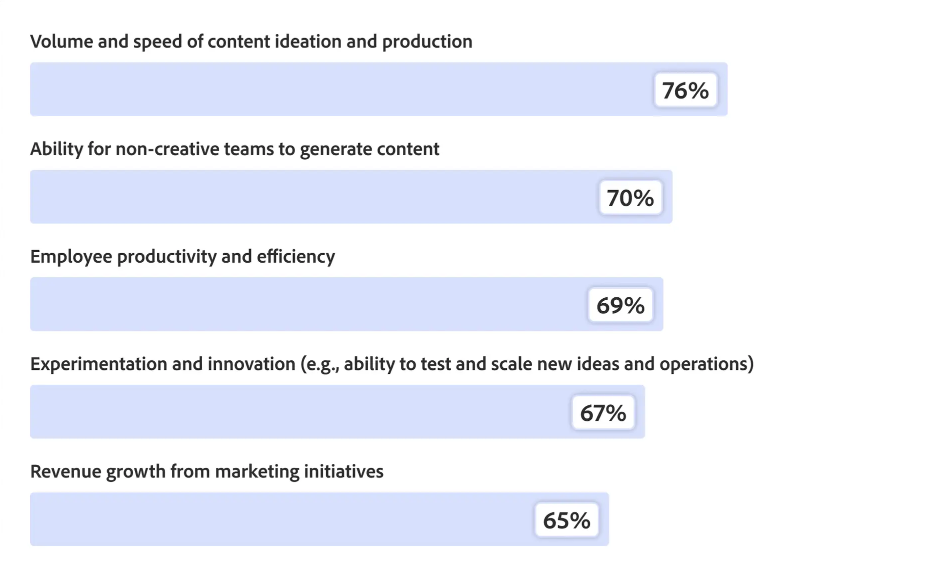
Organizations report clear gains from generative AI: content volume (76%), ability for non-creative teams to generate content (70%), employee productivity (69%), experimentation and innovation (67%), and revenue growth from marketing (65%). (Adobe)
Figure 10. Where organizations report gains from generative AI. Source: Adobe.
Generative AI has improved personalization (70% say it improved somewhat or significantly), lead generation (64%), and customer retention (59%). (Adobe)
In 2025, 69% of teams plan to increase or maintain their investments in AI tools to support web initiatives. (Webflow)
By 2026, generative AI is expected to reshape 70% of the design and development effort for new web apps. (Clutch)
How AI is changing discovery and trust
AI is not only changing how websites are built; it is also changing how people discover them.
One in four customers already turn to AI-powered platforms as their primary source when searching for information, making purchase decisions, or finding recommendations, surpassing brand websites and online reviews. (Adobe)
Traffic to retail sites from generative AI tools increased 693.4% over the 2025 holiday season compared to the year before. (Adobe)
60% of organizations say AI-powered service and support will define breakthrough customer experience over the next two to three years. (Adobe)
Within the next 18 months, organizations expect agentic AI to handle about half or more of interactions in customer support (78%), post-purchase support (70%), and sales (69%). (Adobe)
Yet only 54% of organizations are preparing to optimize content for AI-powered discovery tools, even as customers increasingly rely on them. (Adobe)
52% of marketing leaders will prioritize optimizing for AI-driven search and summaries in 2026. (Webflow)
58% of consumers are only somewhat or not at all comfortable using AI tools to engage with brands, and 86% say human interaction is moderately or very important in their brand experience. (PwC)
A third of customers would disengage upon discovering content is AI-generated, and 37% say the same if they learn they are interacting with AI when expecting a person. (Adobe)
The takeaway is that AI is now woven into how websites get designed and built, and it is delivering real speed and output gains. But users are still wary of AI they did not ask for, so the winning approach is to use AI to accelerate the work while keeping a human, transparent experience at the front end.
Web Designer Job Market Statistics
Demand for web design talent continues to grow, but many employers say skilled professionals are increasingly difficult to find. Companies are shifting toward skills-based hiring and turning to freelancers to close the gap. The statistics below show how the web design job market is evolving.
The web design and development industry is seeing roughly 9% annual growth in job postings globally. (Web Professionals Global)
There were 214,900 web developer and digital designer jobs in the US in 2024, and employment is projected to grow 7% through 2034, opening up about 14,500 roles a year. (BLS)
The number of web developers and digital interface designers in the US is forecast to grow from about 200,000 in 2022 to over 229,000 by 2032. (Statista)
That demand is outpacing supply: 95% of tech leaders say they struggle to find skilled designers and developers. (Clutch)
65% of tech leaders report internal skills gaps, and 62% say those gaps have grown worse over the past year. (Clutch)
Compensation remains strong. The median pay for web developers and digital designers in the US was $95,380 a year, or $45.85 an hour, in 2024. (BLS)
Within that group, web and digital interface designers earned a median of $98,090, while web developers earned $90,930. (BLS)
Despite competitive salaries, many employers say qualified talent remains hard to find, so hiring is shifting from credentials toward proven skills, with freelancers filling much of the gap. 81% of C-suite executives say their organizations are adopting skills-based hiring practices, including removing degree requirements. (Upwork)
74% of executives say degrees are irrelevant when hiring freelancers, and 76% of executives (rising to 78% of CEOs) say their top freelancers contribute more value than degree-holding employees. (Upwork)
Nearly half of full-time workers (49%) now rely on freelancers, and 41% turn to them for technical skills such as web design. (Upwork)
48% of CEOs plan to increase their freelance hiring over the next 12 months. (Upwork)
On Upwork, freelance web designers worldwide charge a median of about $21 an hour, typically between $15 and $30. (Upwork)
Employers are also looking for increasingly specialized expertise. Demand for certifications in specialized web areas has increased 28% year over year. (Web Professionals Global)
New web roles emerged in 2025, including Web Performance Engineer, Privacy-First Designer, Sustainable Web Developer, and Accessibility Specialist. (Web Professionals Global)
For businesses, hiring web design talent in-house is getting harder and more competitive, and many are responding by relying more heavily on freelancers and specialized contractors to access expertise in areas such as accessibility, performance, and privacy without expanding full-time teams. For professionals, the trend points the other way: strong demand, rising specialization, and a growing emphasis on demonstrable skills over formal credentials.
How to Hire the Right Web Design Company
The US web design industry has about 203,000 firms and no dominant player (IBISWorld), so the hard part is not finding options, it is filtering them. A clear, repeatable process beats picking the first portfolio you like. The checklist below walks through how to filter and choose a web design partner.
1. Define your goals, scope, and timeline
Decide what the site has to do before you talk to anyone. Start with the type of site you need, such as a marketing site, an ecommerce store, or a SaaS product site, and whether you also need SEO, content, or branding. Set a realistic target launch date as well: 71% of agencies ship a basic site or MVP in under four weeks, but larger custom builds take far longer (GoodFirms). Your goals shape every later decision, from the type of partner you need, whether an agency, a freelancer, or a blend of in-house staff and contractors, to the budget.
2. Set a realistic budget
Research typical ranges so your expectations match the market. Most web design projects cost under $10,000, while full agency projects run $2,000 to $100,000 depending on scope (Clutch). Extra services like SEO or UX research push the figure higher.
3. Research with clear criteria
Filter candidates on the things that matter to your project rather than browsing at random. Source them from directories and verified review platforms, referrals from people who have run similar projects, and independent reviews on Google or social platforms, not just an agency's own testimonials. Then compare them side by side on a few criteria:
Criterion
Why it matters
Example question
Services offered
Confirms one partner can cover design, build, SEO, and maintenance
"Do you also offer post-launch maintenance?"
Technology and platform expertise
Drives performance, scalability, and who can maintain the site later
"Which platforms do you specialize in, and do you work mobile-first?"
Pricing model
Fixed-price, hourly, and retainer suit different projects and avoid hidden fees
"Do you charge fixed-rate, hourly, or on retainer?"
Portfolio fit
Shows style, range, and a track record in your industry
"Can you share recent projects in our industry?"
4. Build a longlist, then shortlist
Start with every firm that fits your criteria, then narrow the field. Look for relevant industry and feature experience, and read client reviews for reliability and communication. Visit the sites a firm has built and check their speed, responsiveness, and usability. An agency's own website can offer useful signals about usability and performance, but it should not outweigh client work and references. Agencies tend to show only their best work, so contact one or two past clients directly instead of relying on published reviews alone. Narrow down to a shortlist of four to five firms.
5. Interview the shortlist
Ask each firm for a proposal (or RFP) and walk through how they work. The questions a firm asks you can reveal as much as the answers it gives. Useful questions include:
What platform or CMS would you recommend, and why?
How do you make sure the site is fast, SEO-friendly, and fits our marketing strategy?
Can you walk through your design process step by step?
How many rounds of revisions are included?
How do you handle ADA and WCAG accessibility?
Who will actually work on our project, can we meet them, and how much of the work is outsourced?
Who owns the code, design files, and domain after launch?
How do you handle scope changes and added requests?
What support and training do you provide after launch?
What is your typical project timeline?
Give accessibility real weight here: 95.9% of home pages have detectable WCAG failures (WebAIM), so a firm's process for it separates the careful from the careless.
6. Choose your finalists
From the shortlist you interviewed, pick the two or three that fit best. Weigh each against your must-haves rather than flashy extras or promises that do not serve your goals, and re-check the basics: do they fit your priorities and your budget?
7. Watch for red flags
Before you commit, screen your finalists for the warning signs that predict a difficult project:
No portfolio or client references.
Vague answers about tools, frameworks, or process.
Unclear pricing or timelines that keep shifting.
Slow or weak communication during the sales process.
Big promises with no case studies or data to back them up.
Avoiding any discussion of budget or timeline up front.
The strongest firms often do the opposite: they ask detailed questions about your goals, recommend against scope you do not need, give transparent pricing and timelines, and can name the people who will actually do the work.
8. Sign with the right partner
Once you decide, request a service level agreement that spells out scope, milestones, payment terms, ownership of the code and design assets, and post-launch support, and review (and negotiate) it before signing.
The best web design company is rarely the cheapest, the largest, or the one with the flashiest portfolio. It is the firm that understands your goals, explains its process clearly, and can demonstrate success on projects similar to yours. And whoever you choose, the result has to be a fast, accessible, mobile-first site: with more than half of web traffic now on mobile, that is the baseline for visibility and conversions, not a nice-to-have.
Final Thoughts
Web design in 2026 is a business decision, not a cosmetic one. Websites sit at the intersection of branding, search visibility, user trust, and conversion, which is why design choices increasingly have measurable business outcomes.
The throughline across every chapter is the same: design is measurable. Users judge a site largely on how it looks, and the businesses that treat design as a revenue lever consistently outgrow the ones that treat it as decoration. A fast, accessible, mobile-first website with a clear, trustworthy design is no longer a nice-to-have: it is the baseline for being found, being believed, and converting the visitors you already have.
AI is changing how sites get built, but it is augmenting designers, not replacing them, and skilled talent is harder to hire than ever. That makes how, and with whom, you build your website one of the higher-leverage decisions a business can make.
{{post-cta}}
Frequently Asked Questions
Is web design still in demand in 2026?
Yes. The global web design market is projected to reach $92 billion by 2030, up from $61.2 billion in 2025 (Mordor Intelligence), and job postings are growing about 9% a year (Web Professionals Global). 95% of tech leaders say they struggle to hire skilled designers and developers (Clutch), and US employment for web developers and digital designers is projected to grow 7% through 2034 (BLS).
How much does it cost to pay someone to design a website?
It depends on who builds it and how custom it is. Web design agencies typically charge $2,000 to $100,000 per project, with the average project costing about $38,105, though most cost under $10,000 (Clutch). A ready-made template can cost as little as $20, while professional web design services run $500 to $50,000+ (WebFX).
Is AI replacing web design?
AI is augmenting web design, not replacing it. 93% of web designers now use AI tools, mainly for imagery, layouts, and testing (Clutch), and 85% say AI will be essential to their future success (Figma). But 40% do not fully trust AI-generated outputs, and designers see human-AI collaboration, not full automation, as the future.
What is accessibility in web design?
Accessibility means designing and building a site so people with disabilities can perceive, navigate, and use it, usually by following the WCAG guidelines. It is also a business issue: 71% of users with disabilities leave a site they cannot use, 1.3 billion people worldwide live with a disability, and 75% of survey respondents say accessibility contributes to improved revenue (Clutch, Level Access).
Why is web design important?
A website is often the first impression and the main place customers convert, so design directly affects revenue. 91% of teams say their website drives more revenue than any other marketing channel (Webflow), better checkout design can lift conversions by 35.26% for the average large ecommerce site (Baymard), and 52% of consumers stop buying from a brand after a bad experience with its products or services (PwC).
If you're evaluating web design agencies, Foursets can help. We design and build fast, scalable websites for B2B companies, combining web design, development, SEO, AI search optimization (AEO), platform migrations, third-party integrations, and ongoing maintenance under one roof. From new websites and redesigns to migrations and ongoing support, we build websites designed to grow with your business. Get in touch to discuss your project, goals, and timeline.


.avif)

