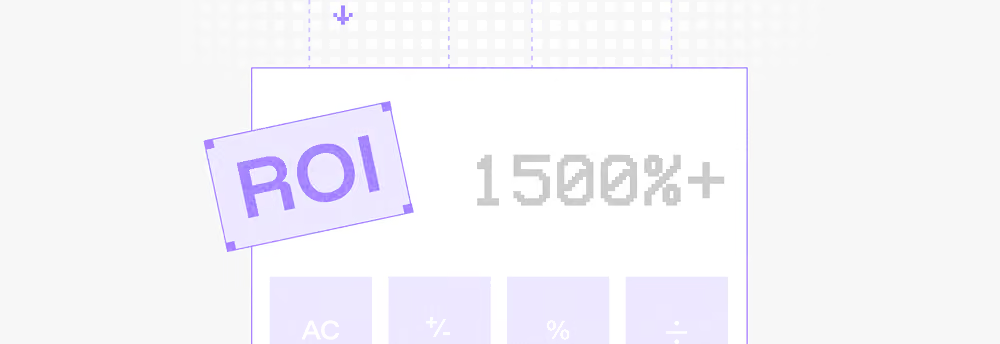
You already know your CMS is holding you back. The hard part is getting budget approval for the move. This guide walks you through the full ROI calculation: every cost item, every post-migration benefit, and the formula that turns a gut feeling into a CFO-ready business case. Plus a Google Sheets template to plug your own numbers in.

Used by marketing teams at:
OUTCOMES
What you’ll walk away with

The real cost of staying on your current CMS
It’s not just the subscription. The hidden cost is dev hours, missed campaigns, SEO drag, and the weeks your team waits for a single page change. The guide breaks down the full cost of the status quo so you can compare it honestly to the migration cost.

A dollar value for every day your team waits to ship a page
The financial impact of shipping a landing page in 2 days instead of 2 weeks. The guide gives you the formula and shows you how to defend it. Every faster campaign launch is revenue you’d otherwise leave on the table.

Your projected revenue uplift in dollars per year
A formula that turns your traffic, conversion rate, and ACV into a hard annual projection. The worked example: $369,600 in additional annual revenue from a modest traffic lift and a 2-point conversion bump.

Your annual maintenance savings, line by line
How much cheaper your website becomes once the dev backlog disappears, the plugin subscriptions get cancelled, and your team stops paying contractors for every CMS update. The guide quantifies all of it.

Your exact ROI percentage and payback period in months
Plug in your numbers. The guide gives you both. A percentage and a timeline measured in months, not “eventually.” The worked example hits 1,167% ROI and a payback under 4 months.

A live calculator your CFO will be happy with
Every formula from the guide, in a Google Sheet. Change the inputs, watch the ROI shift. When your CFO asks “what if traffic only grows 10%?”, you have an answer in 30 seconds.
NUMBERS
We’ve executed dozens of migrations to Webflow. The numbers below are why your team should trust the math in this document.
500+
Page website migrations executed with full URL restructuring and zero loss of organic traffic.
50+
Websites migrated for B2B companies since 2021.
100+
B2B clients served across 25+ countries and counting.
4 months
Average migration payback period for our clients.
553%
Minimum ROI across 50+ migrations we’ve delivered.
56%
Average uplift in organic traffic in the first three months after migration.
100+
Technical SEO audits and migration plans built from scratch.
BEFORE & AFTER
From guesswork to a defensible business case


Testimonials
AWARDS
Every formula, cost item, and benchmark in this document came from real B2B website migrations we’ve executed. The badges below are the receipts.

Your CMS is slow. Your campaigns wait on engineers. Every leadership conversation ends with “we’ll revisit it next quarter.” Download the guide, run your numbers, and walk back in with a payback period and an ROI percentage that close the conversation in a single meeting.